
- Moving the market
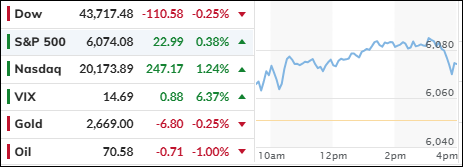
The major indexes started the week on a positive note, with two out of three heading higher, led by the Nasdaq. However, AI chip powerhouse Nvidia did not participate in the upswing and slipped into red territory.
The Federal Reserve will commence its final FOMC policy meeting of the year tomorrow, with results to be announced on Wednesday. A 0.25% rate cut is anticipated, but traders will be keenly watching for any changes to forward guidance, especially given the recent worsening of inflation numbers. The ongoing discussion revolves around whether these numbers signify the beginning of a new trend.
While the S&P 500 continues to inch higher, underlying indicators paint a less optimistic picture. As highlighted by ZH, market breadth, which measures advances versus declines, has worsened for 11 consecutive days.
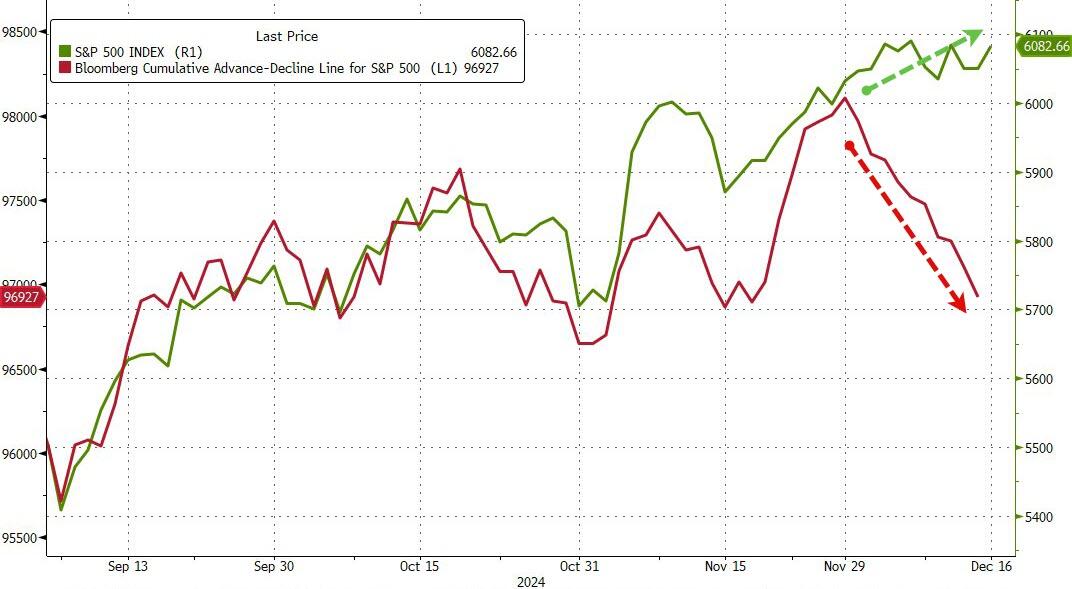
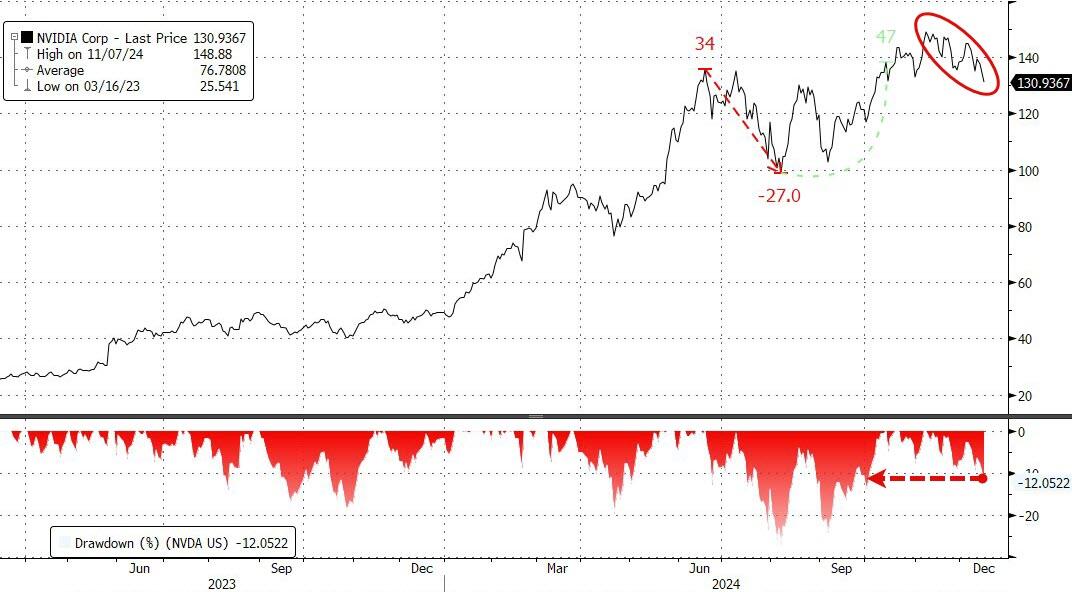
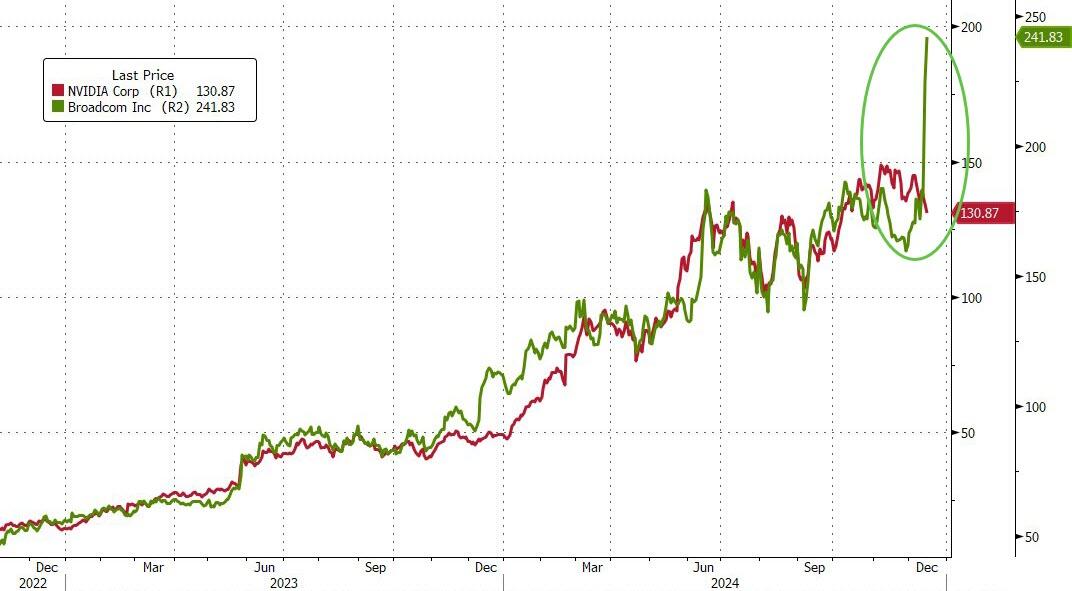
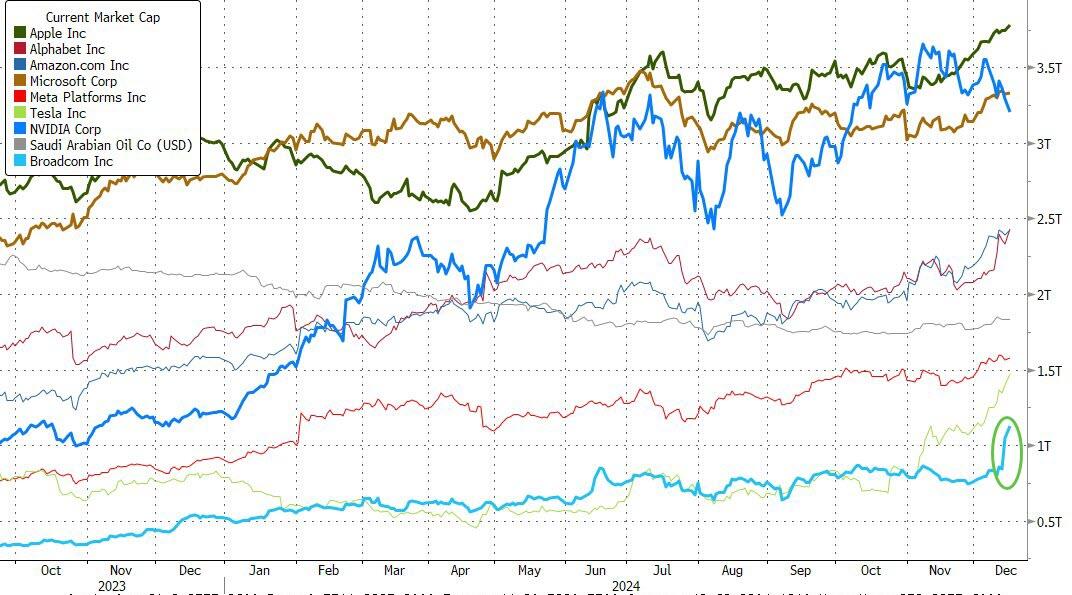
Mega Cap stocks are showing prolonged strength to the upside. However, tech darling Nvidia plunged into correction territory today, down over 12% from its record high. In contrast, Broadcom surged higher, joining the $3 trillion club.
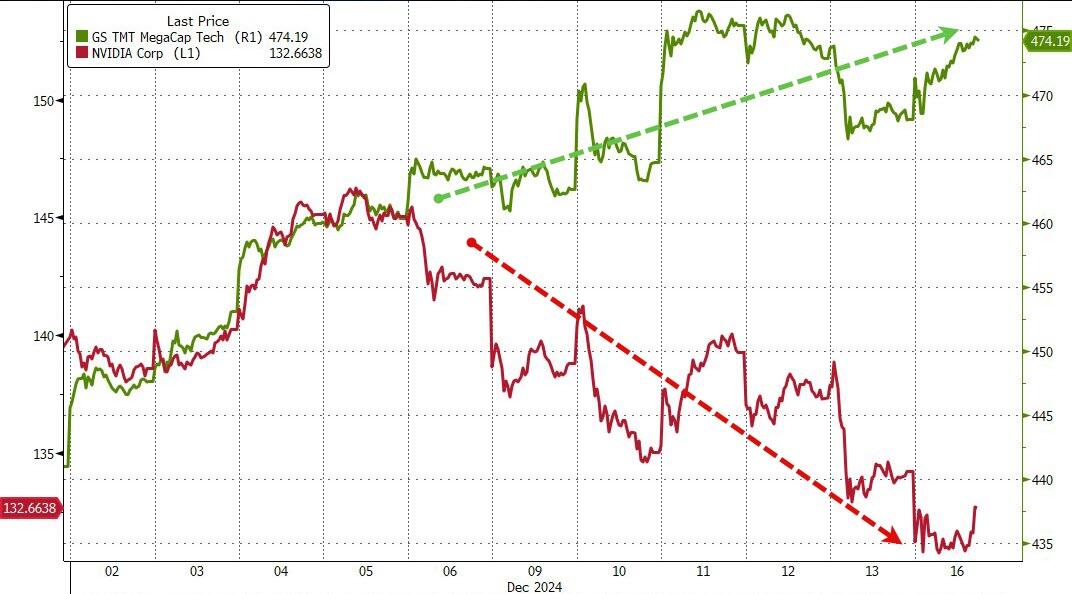
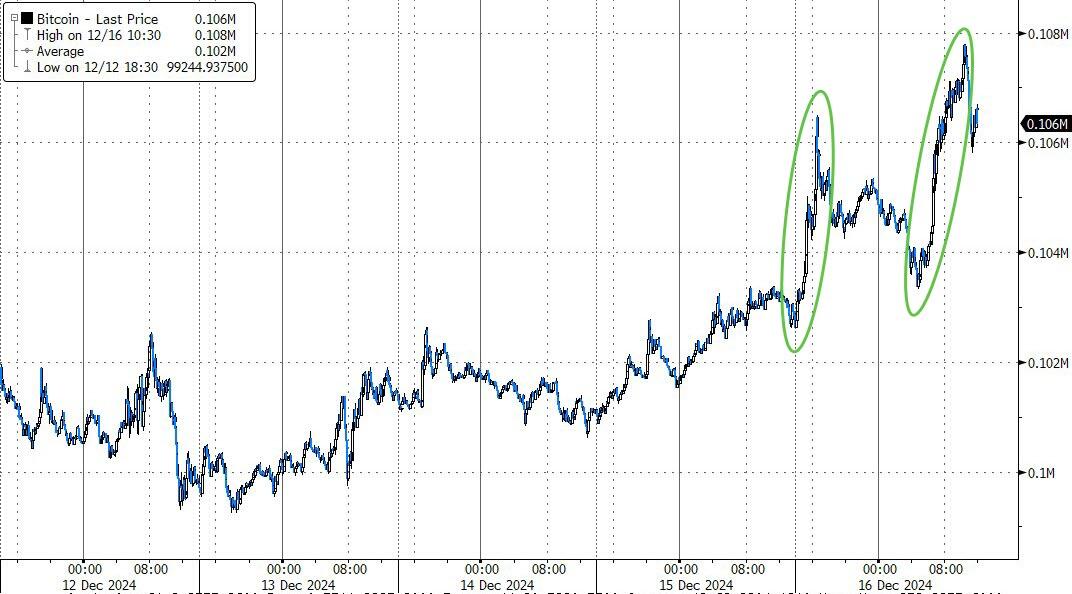
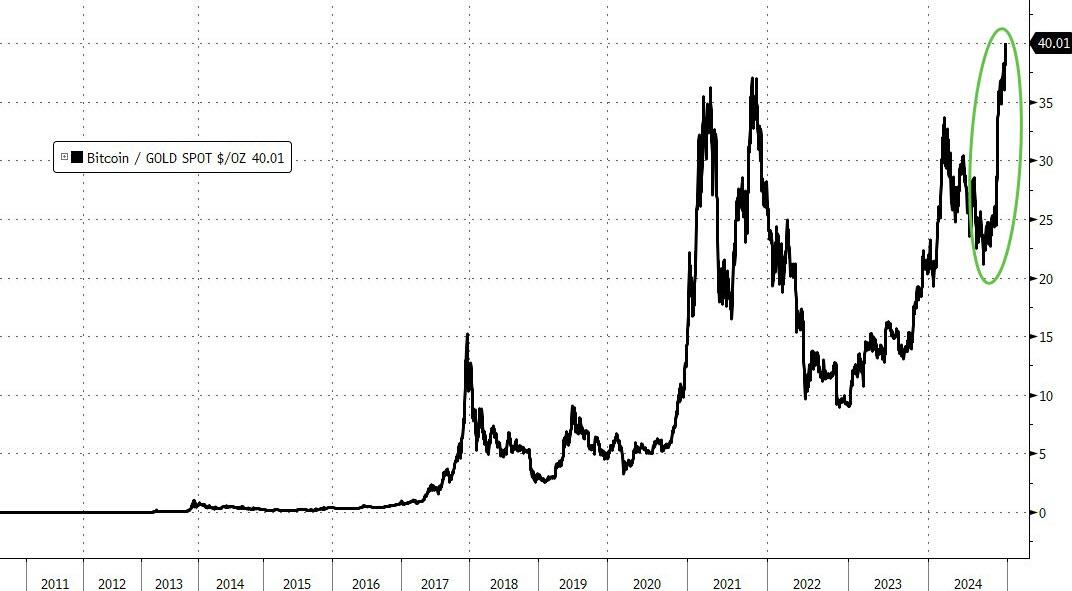
Bitcoin underwent a rally over the weekend and surged this morning, nearing $108,000 before pulling back. Its ratio to gold also reached record levels, with one Bitcoin now equivalent to 40 ounces of gold.
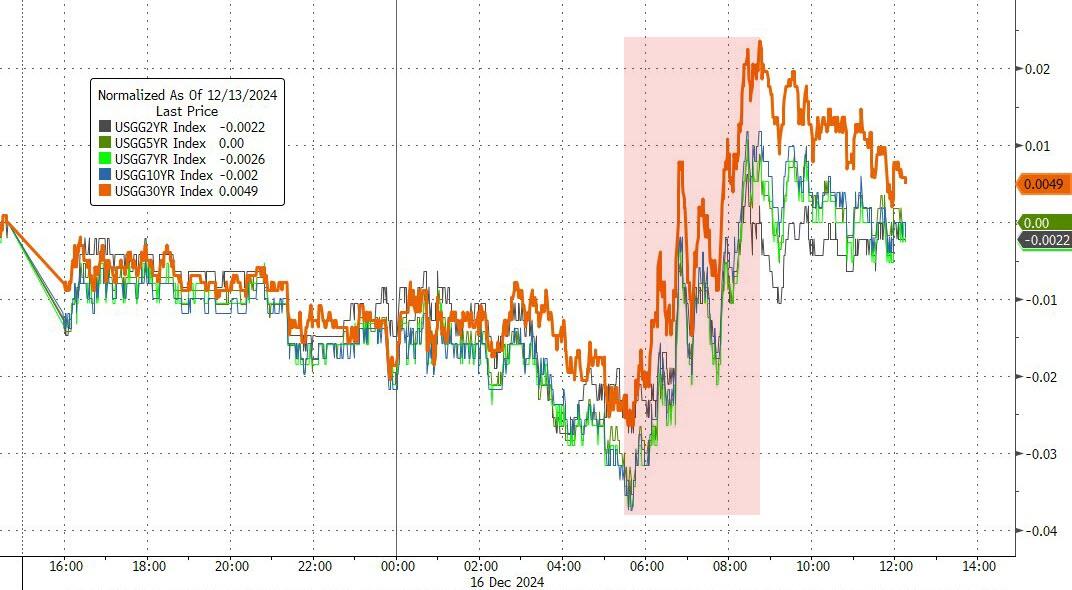
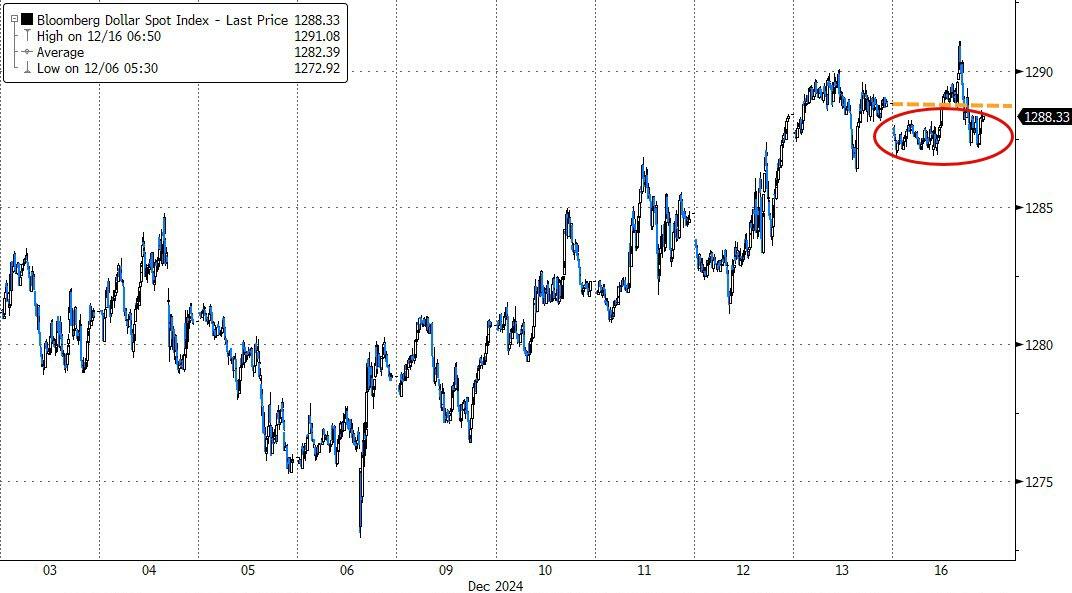
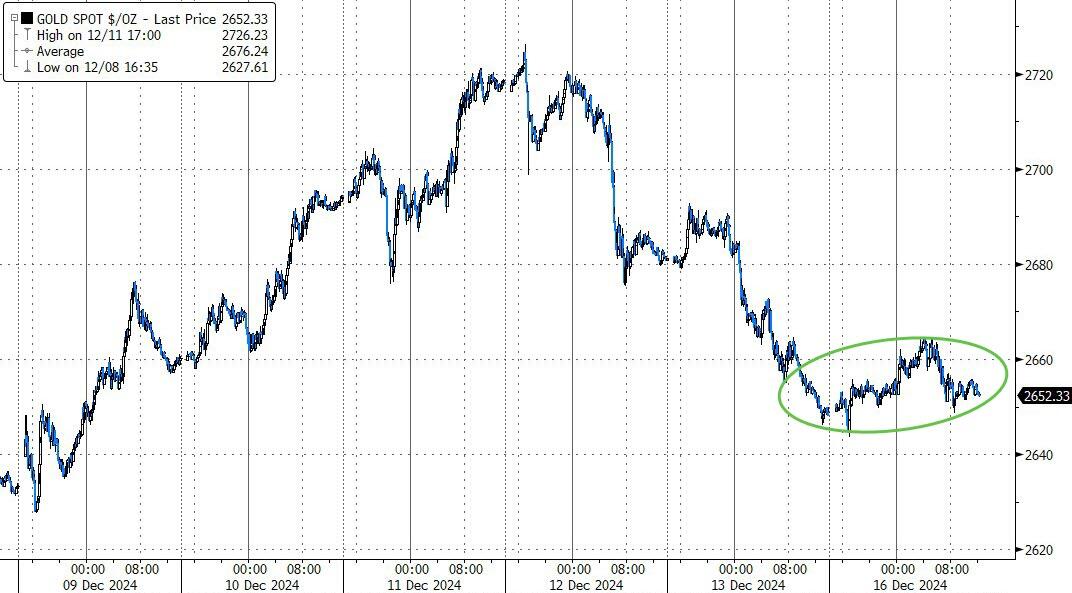
Bondholders have faced continuous challenges, with yields rising for the seventh consecutive day. Meanwhile, the dollar ended a six-day winning streak by dipping slightly lower, and gold followed suit but found support at $2,650.
Traders are hopeful for a rate cut but also question its wisdom given the current market levels and overall economic conditions.
Are the released data points indeed accurate?
2. Current “Buy” Cycles (effective 11/21/2023)
Our Trend Tracking Indexes (TTIs) have both crossed their trend lines with enough strength to trigger new “Buy” signals. That means, Tuesday, 11/21/2023, was the official date for these signals.
If you want to follow our strategy, you should first decide how much you want to invest based on your risk tolerance (percentage of allocation). Then, you should check my Thursday StatSheet and Saturday’s “ETFs on the Cutline” report for suitable ETFs to buy.
3. Trend Tracking Indexes (TTIs)
Despite the Dow lagging, both the S&P 500 and Nasdaq managed to close in positive territory, with the Nasdaq displaying the most optimistic sentiment.
Our TTIs did not follow this upward trend, as both suffered modest declines. However, these slips did not alter our current market outlook.
This is how we closed 12/16/2024:
Domestic TTI: +6.11% above its M/A (prior close +6.46%)—Buy signal effective 11/21/2023.
International TTI: +3.66% above its M/A (prior close +3.94%)—Buy signal effective 11/21/2023.
All linked charts above are courtesy of Bloomberg via ZeroHedge.
———————————————————-
WOULD YOU LIKE TO HAVE YOUR INVESTMENTS PROFESSIONALLY MANAGED?
Do you have the time to follow our investment plans yourself? If you are a busy professional who would like to have his portfolio managed using our methodology, please contact me directly to get more details.
Contact Ulli