ETF Tracker StatSheet
You can view the latest version here.
MAJOR AVERAGES POST BEST WEEK SINCE 2023 FOLLOWING ELECTION

- Moving the market
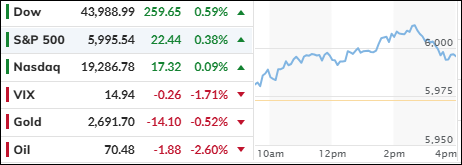
This morning, the Dow and the S&P 500 moved higher, while the Nasdaq lagged, as traders considered the implications of the post-election rally and the Federal Reserve’s latest interest rate cut.
By the end of the week, all three major averages had posted strong gains, largely driven by a massive rally on Wednesday following Trump’s election victory. This marked their best week since November 2023.
Small-cap stocks led the charge, surging over 7% during the five-day period, fueled by a significant short squeeze.
Despite these impressive gains, traders are cautious, viewing the market as technically overbought and questioning the sustainability of these moves. However, the journey to close above the S&P 500’s $6,000 level continues, supported by favorable seasonal trends.
Wall Street generally perceives a Republican-controlled government as beneficial, anticipating deregulation, increased mergers and acquisitions, and proposed tax cuts. However, concerns about rising debt and deficits and their potential impact on inflation persist.
Bond yields experienced significant volatility, initially spiking the day after the election before tapering off towards the week’s end.
The dollar strengthened for the sixth consecutive week, leading to a decline in gold prices. Meanwhile, Bitcoin had its second-best week of the year, setting several record highs, bolstered by substantial inflows into Bitcoin ETFs.
The cryptocurrency appears to be on a path towards $80,000, though the timing remains uncertain.
2. Current “Buy” Cycles (effective 11/21/2023)
Our Trend Tracking Indexes (TTIs) have both crossed their trend lines with enough strength to trigger new “Buy” signals. That means, Tuesday, 11/21/2023, was the official date for these signals.
If you want to follow our strategy, you should first decide how much you want to invest based on your risk tolerance (percentage of allocation). Then, you should check my Thursday StatSheet and Saturday’s “ETFs on the Cutline” report for suitable ETFs to buy.
3. Trend Tracking Indexes (TTIs)
This week on Wall Street was marked by significant activity, particularly in the wake of the recent elections. The S&P 500 made headlines today by surpassing the $6,000 mark for the first time.
However, despite this milestone, the index retreated below this level by the close of trading. Overall, the S&P 500 managed to gain approximately 5% over the week, although it continues to trail gold’s year-to-date performance.
In addition to the S&P 500’s movements, our TTIs also participate in the rally. Notably, the Domestic TTI outperformed its international counterpart, which lagged in today’s trading session.
This is how we closed 11/08/2024:
Domestic TTI: +9.48% above its M/A (prior close +9.33%)—Buy signal effective 11/21/2023.
International TTI: +5.20% above its M/A (prior close +6.01%)—Buy signal effective 11/21/2023.
All linked charts above are courtesy of Bloomberg via ZeroHedge.
———————————————————-
WOULD YOU LIKE TO HAVE YOUR INVESTMENTS PROFESSIONALLY MANAGED?
Do you have the time to follow our investment plans yourself? If you are a busy professional who would like to have his portfolio managed using our methodology, please contact me directly to get more details.
Contact Ulli