
- Moving the market
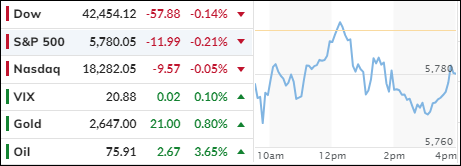
The major indexes retreated from their elevated levels as rising inflation and unemployment provided traders with a sobering reality check.
Despite these concerning figures, the pullback was moderate, even though they suggest potential stagflation—characterized by higher inflation coupled with stagnant or slow economic growth.
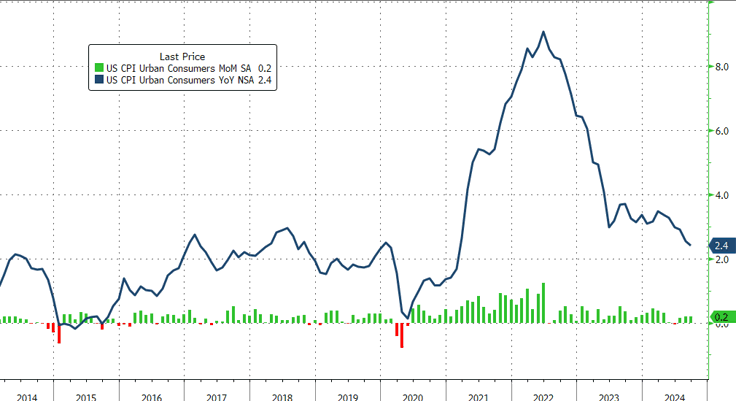
Core consumer prices, a key metric favored by the Federal Reserve, increased by 0.3% month-over-month, surpassing the expected 0.2% and marking the strongest reading since March. Year-over-year, this resulted in a rise of 3.3%, slightly above the anticipated 3.2%.
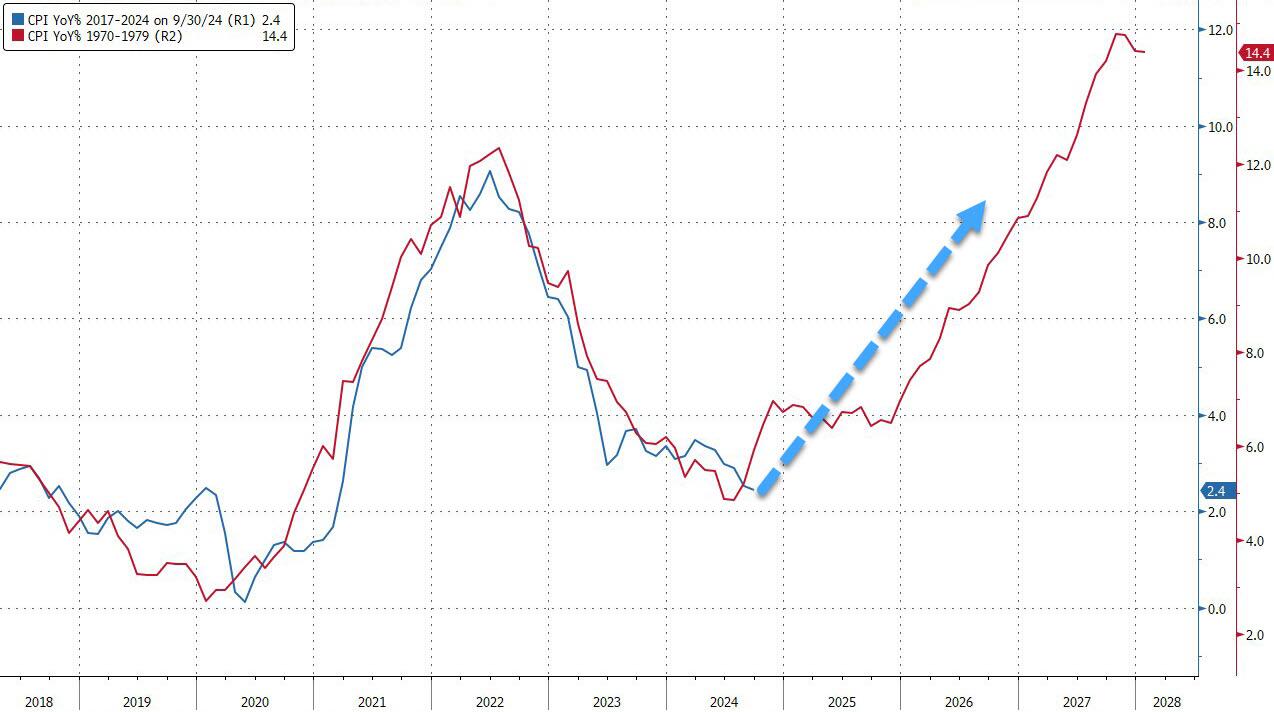
The headline Consumer Price Index (CPI) also climbed, with the year-over-year figure reaching 2.4% compared to the expected 2.3%. This indicates that CPI has been accelerating over the past two administrations, with a more pronounced increase in the last four years.
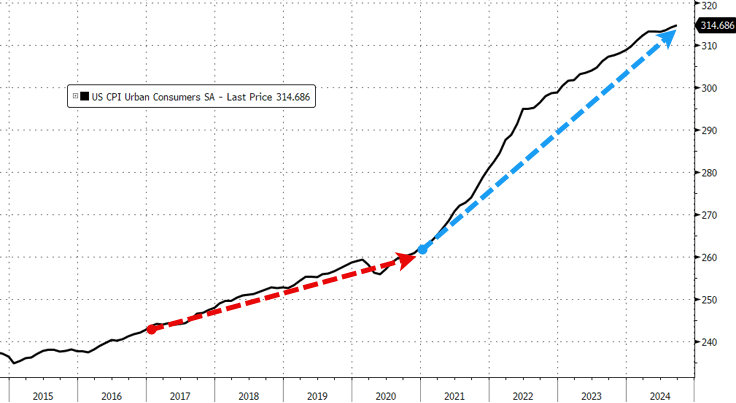
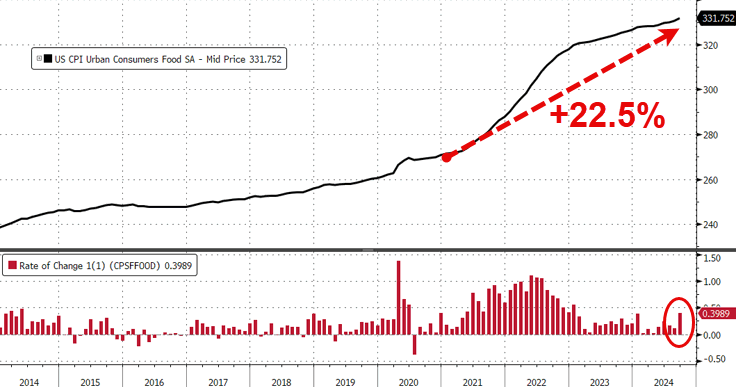
Food inflation has been relentless, showing a staggering growth of 22.5% over the past four years.
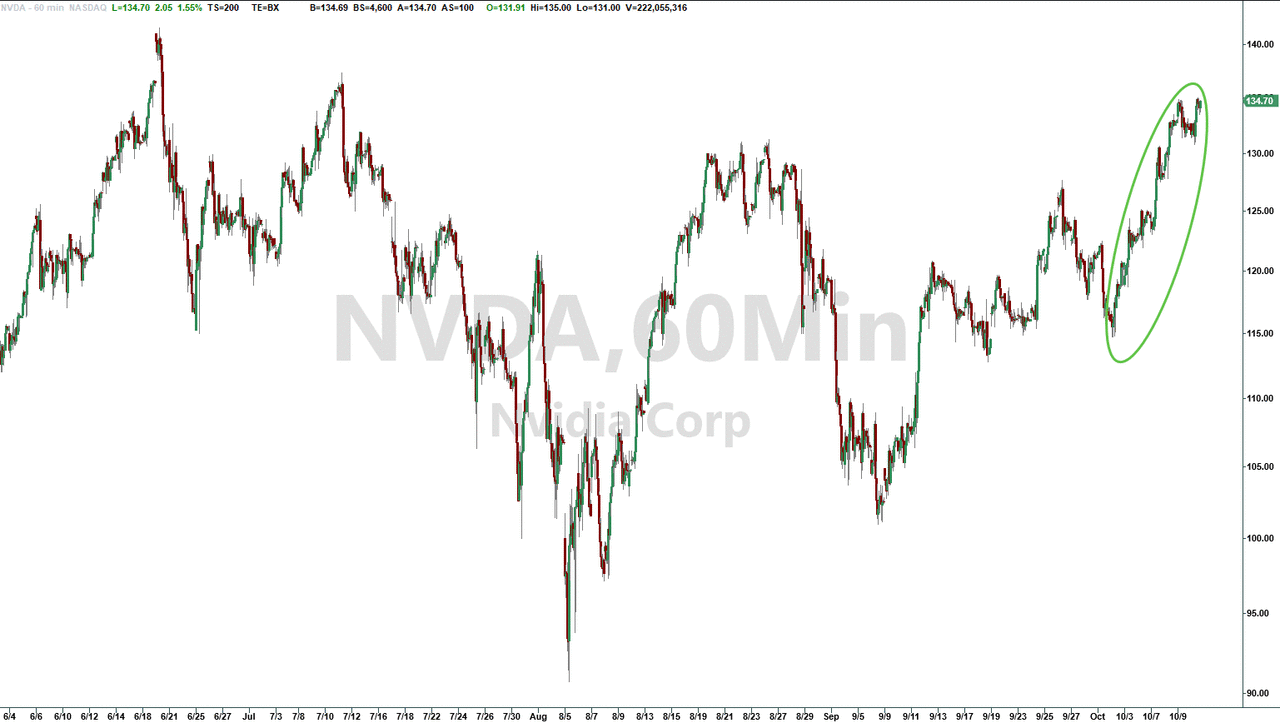
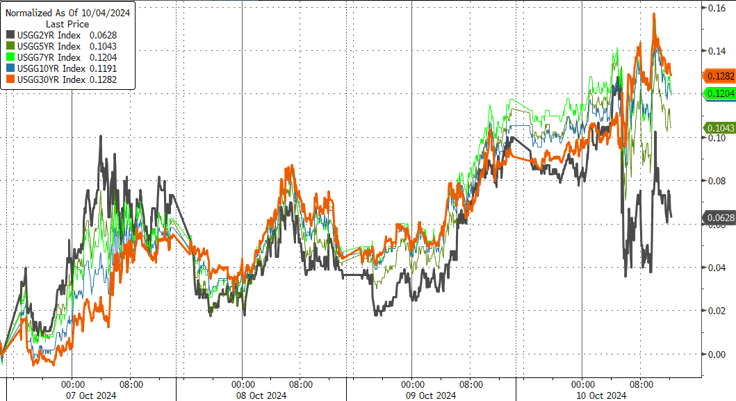
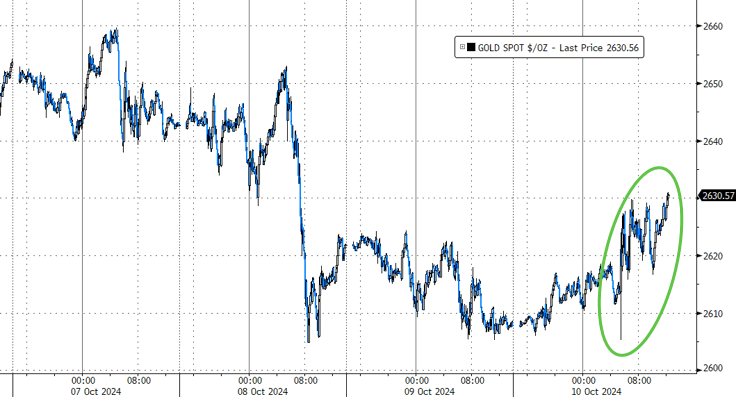
Bucking the day’s trend, Nvidia gained over 1.6% during the session. Bond yields were mixed, the dollar rallied for the eighth consecutive day, and gold prices also rose, recovering from a recent dip.
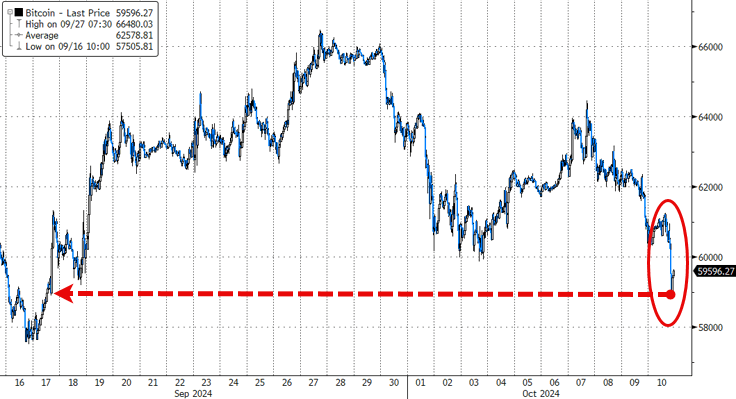
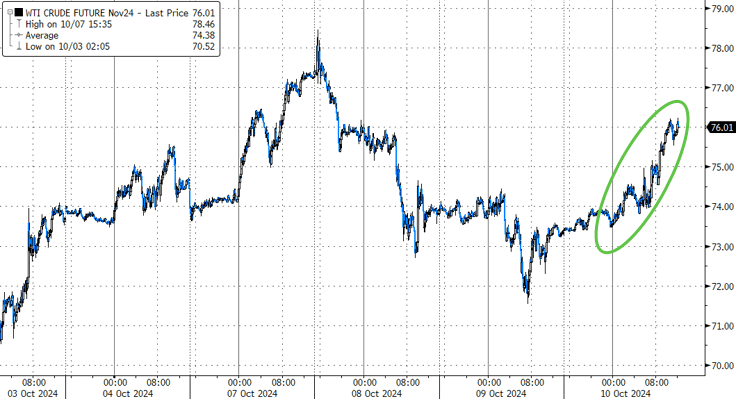
However, Bitcoin faced a bearish session, dropping below the $60,000 mark, while crude oil surged, reaching $76 on an intraday basis.
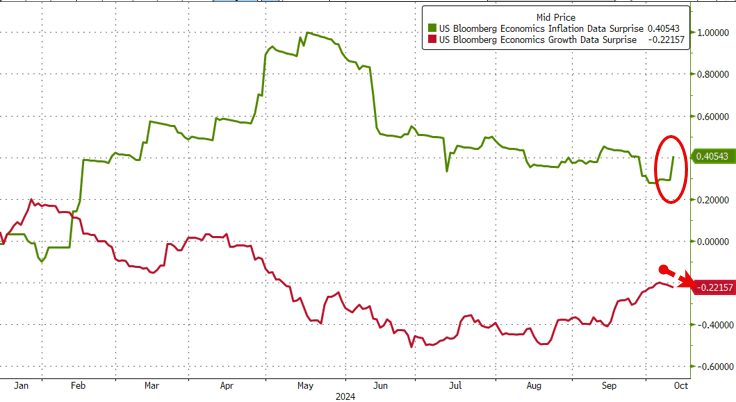
Given these developments, it seems inflation might remain a persistent issue. Could we be on the verge of experiencing an inflation scenario reminiscent of the 1970s?
2. Current “Buy” Cycles (effective 11/21/2023)
Our Trend Tracking Indexes (TTIs) have both crossed their trend lines with enough strength to trigger new “Buy” signals. That means, Tuesday, 11/21/2023, was the official date for these signals.
If you want to follow our strategy, you should first decide how much you want to invest based on your risk tolerance (percentage of allocation). Then, you should check my Thursday StatSheet and Saturday’s “ETFs on the Cutline” report for suitable ETFs to buy.
3. Trend Tracking Indexes (TTIs)
Today’s economic indicators, higher inflation and rising unemployment rates, prompted traders to adopt a more cautious approach. This shift in sentiment led to a modest decline in the major stock indexes as they pulled back from their recent highs.
Similarly, our TTIs mirrored this trend, although the international TTI demonstrated greater resilience in the face of today’s pullback.
This is how we closed 10/10/2024:
Domestic TTI: +7.98% above its M/A (prior close +8.38%)—Buy signal effective 11/21/2023.
International TTI: +7.22% above its M/A (prior close +7.18%)—Buy signal effective 11/21/2023.
All linked charts above are courtesy of Bloomberg via ZeroHedge.
———————————————————-
WOULD YOU LIKE TO HAVE YOUR INVESTMENTS PROFESSIONALLY MANAGED?
Do you have the time to follow our investment plans yourself? If you are a busy professional who would like to have his portfolio managed using our methodology, please contact me directly to get more details.
Contact Ulli