
ETF Tracker StatSheet
You can view the latest version here.
ELECTION UNCERTAINTY LOOMS OVER MARKETS AS BOND YIELDS CLIMB
- Moving the market
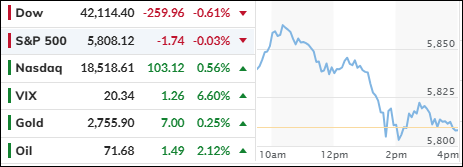
Building on yesterday’s gains, which ended a three-day losing streak for the S&P 500, the index tried to secure a slight weekly advance.
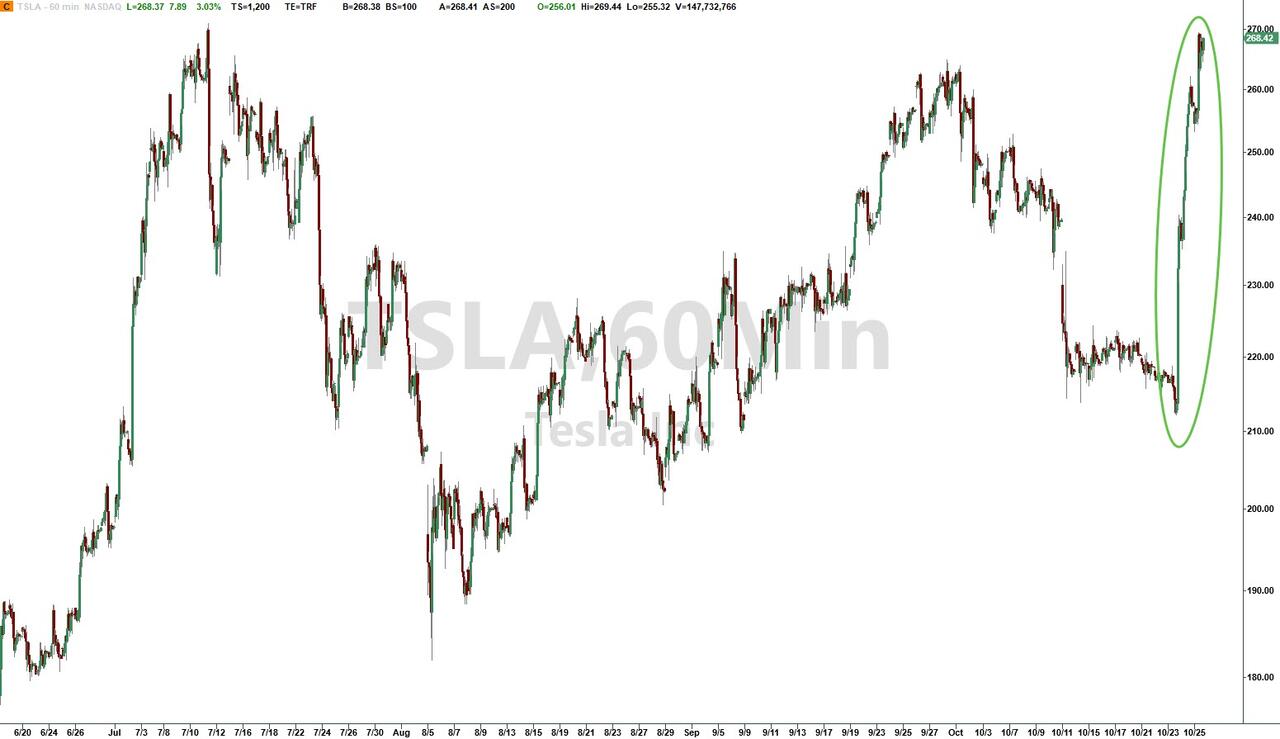
However, this effort was thwarted as the markets sold off towards the close. The Nasdaq, on the other hand, finished Thursday on a positive note, buoyed by Tesla’s remarkable comeback rally. The EV manufacturer had its best day in over a decade, driven by stronger-than-expected profits and optimistic expectations for future vehicle growth.
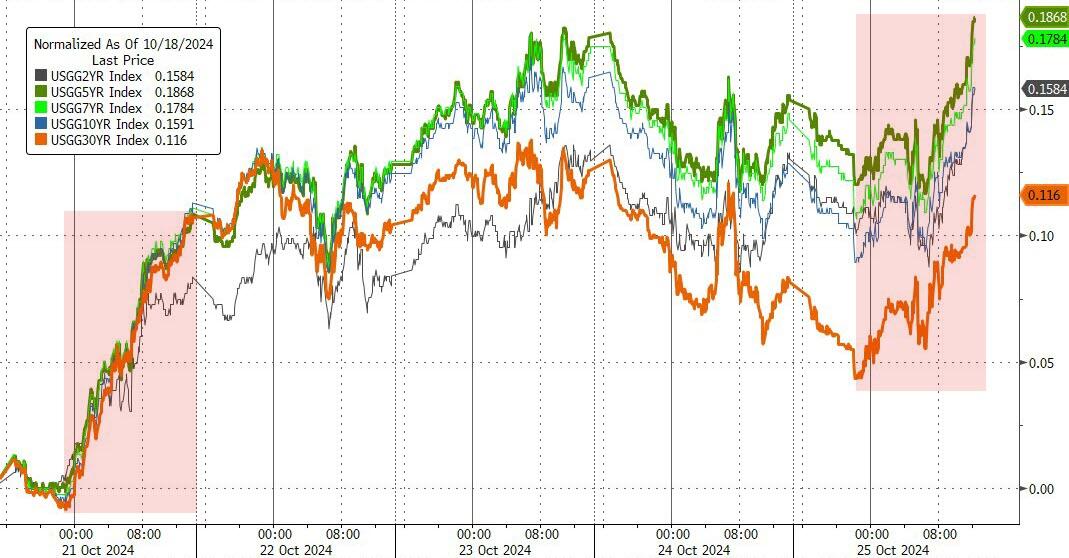
Early in the session, a decline in bond yields provided upward momentum for the indexes, a trend that persisted throughout the day.
However, yields reversed course late in the session, with the 10-year yield rallying and closing at 4.24%. This shift clearly shows the dependency of the S&P 500 and Nasdaq on the direction of interest rates, as higher yields can undermine bullish sentiment.
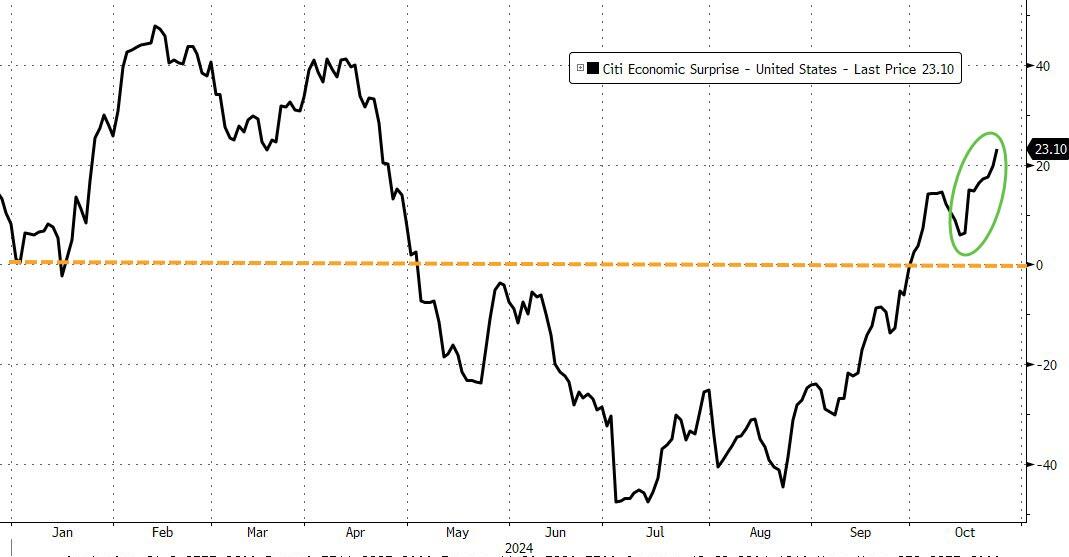
This week, economic macro data exceeded expectations, contributing to the rise in bond yields and raising doubts about whether the Federal Reserve will continue its easing cycle as anticipated.
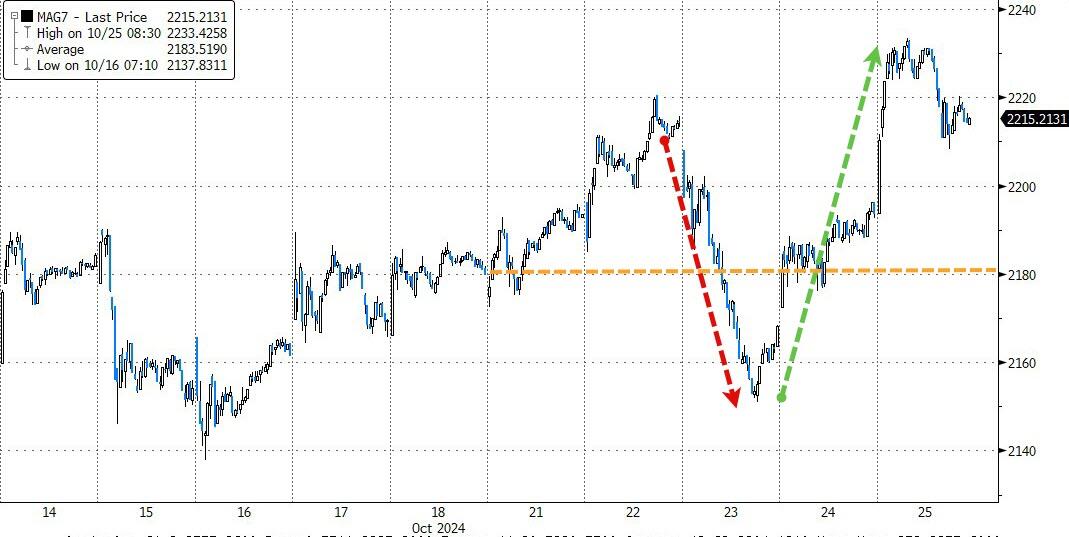
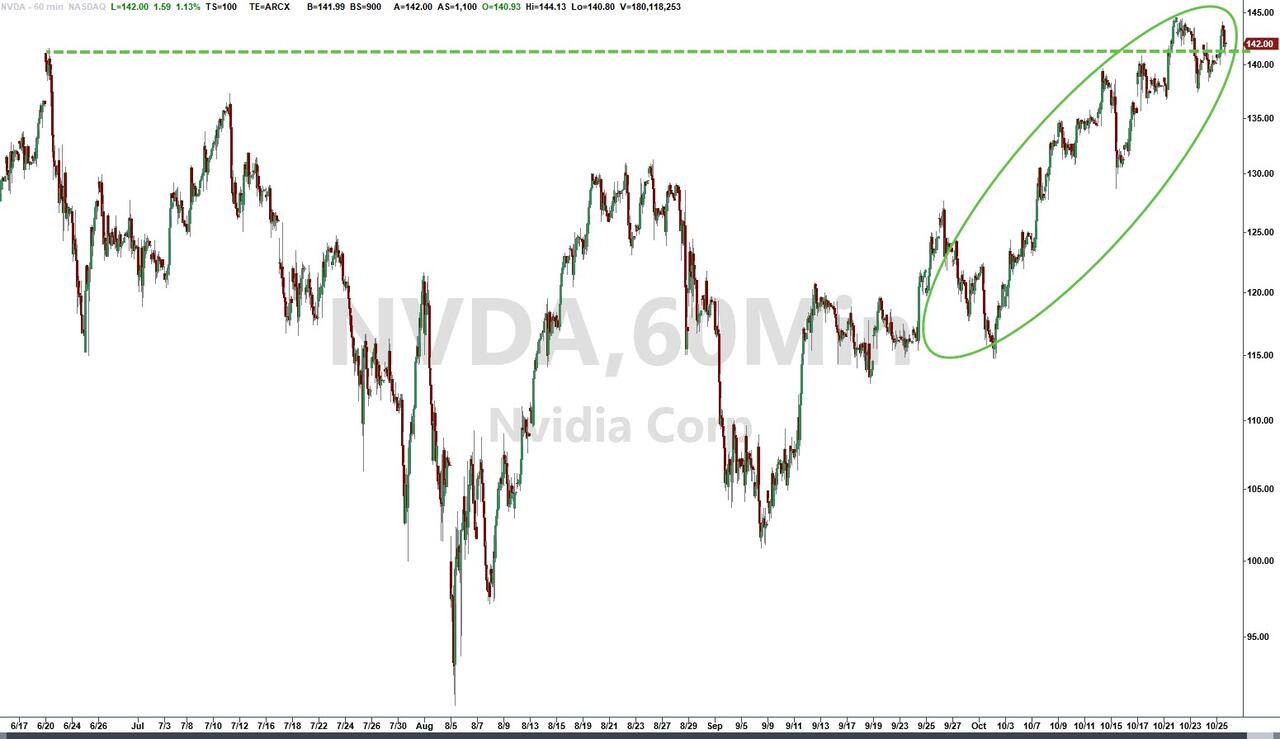
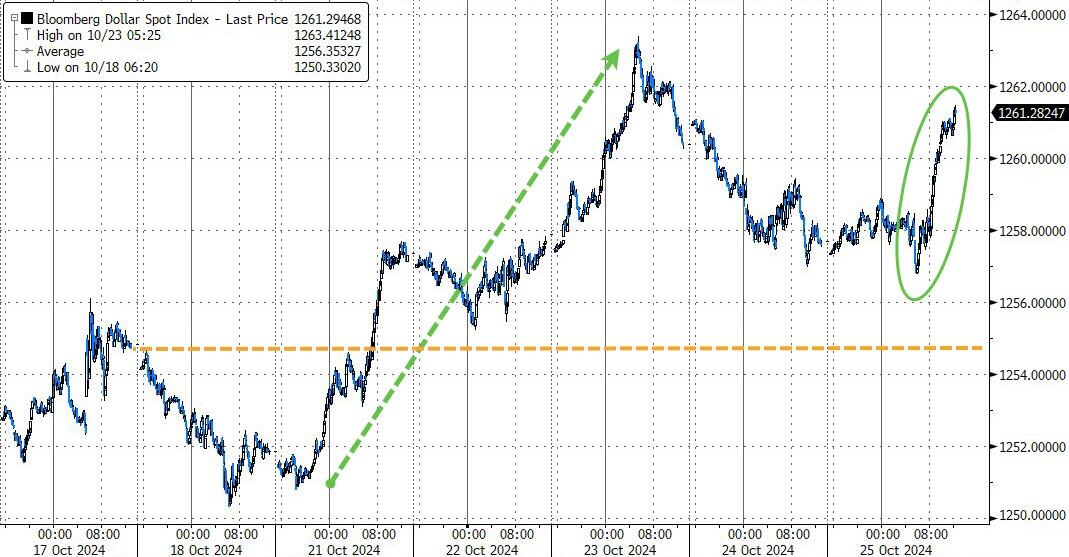
The MAG7 basket underwent a rollercoaster week but ended higher, thanks to gains from Nvidia and Tesla. While rising bond yields kept pressure on equities, they also helped the dollar achieve its highest weekly close since June.
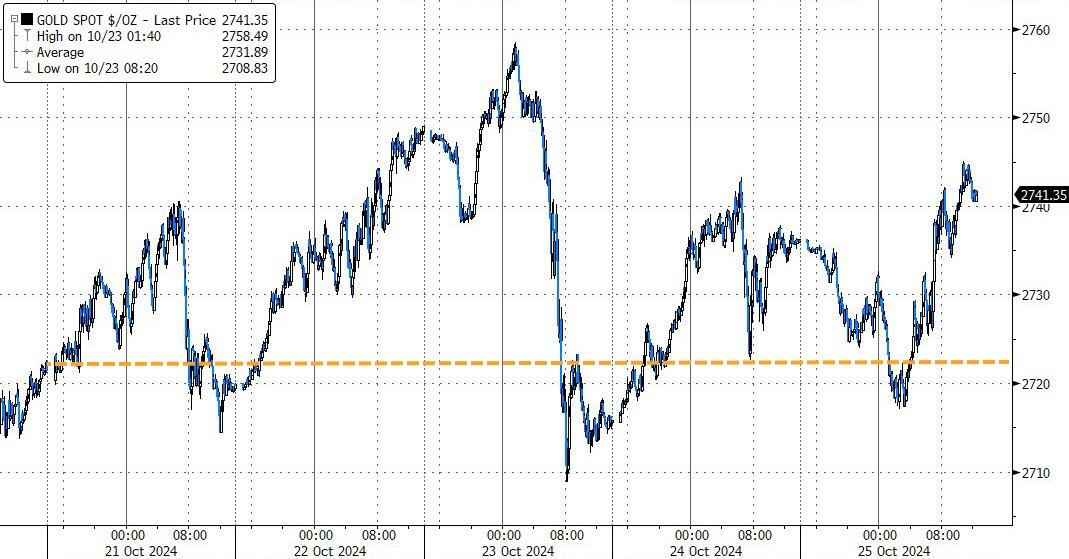
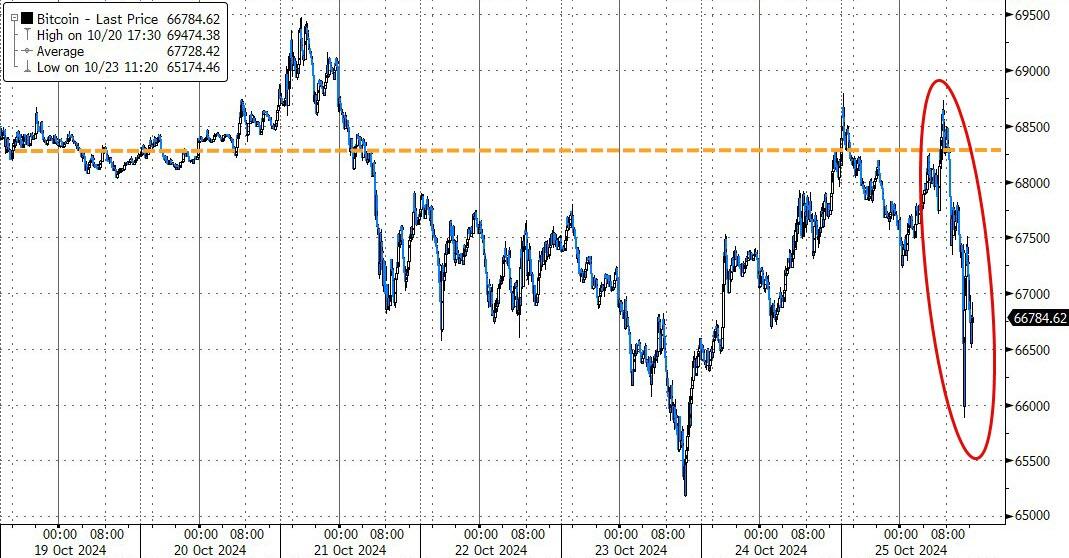
Gold maintained its upward momentum, hitting a new intraday record on Wednesday. Meanwhile, Bitcoin’s advance was halted at the $69.5k level, causing the cryptocurrency to retreat and relinquish its early gains.
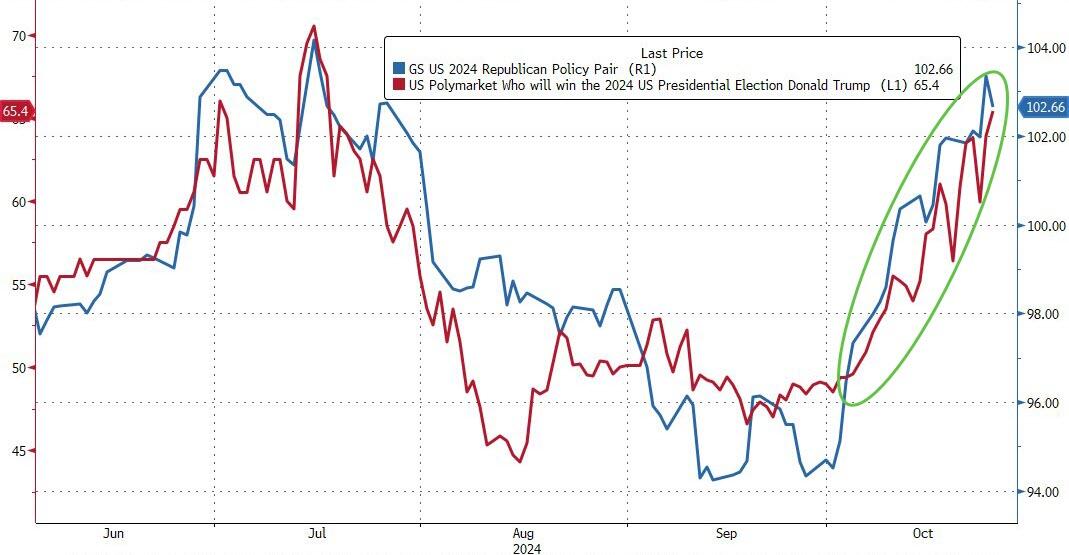
As we approach the upcoming election, it remains the primary focus for traders. Prediction markets currently favor Trump, but as the saying goes, “it’s never over ’till the fat lady sings.”
2. Current “Buy” Cycles (effective 11/21/2023)
Our Trend Tracking Indexes (TTIs) have both crossed their trend lines with enough strength to trigger new “Buy” signals. That means, Tuesday, 11/21/2023, was the official date for these signals.
If you want to follow our strategy, you should first decide how much you want to invest based on your risk tolerance (percentage of allocation). Then, you should check my Thursday StatSheet and Saturday’s “ETFs on the Cutline” report for suitable ETFs to buy.
3. Trend Tracking Indexes (TTIs)
The market underwent a notable shift today. Initially, there was a strong rally that propelled the Dow and S&P 500 to impressive heights.
However, this momentum did not last, and both indices eventually slipped into negative territory. In contrast, the Nasdaq showed resilience, managing to close in positive territory despite the broader sell-off.
Our TTIs also moved downward, yet they remained firmly above their respective trend lines. This positioning suggests that the overall market outlook continues to be positive, despite the day’s fluctuations.
This is how we closed 10/25/2024:
Domestic TTI: +6.69% above its M/A (prior close +7.57%)—Buy signal effective 11/21/2023.
International TTI: +4.74% above its M/A (prior close +5.51%)—Buy signal effective 11/21/2023.
All linked charts above are courtesy of Bloomberg via ZeroHedge.
———————————————————-
WOULD YOU LIKE TO HAVE YOUR INVESTMENTS PROFESSIONALLY MANAGED?
Do you have the time to follow our investment plans yourself? If you are a busy professional who would like to have his portfolio managed using our methodology, please contact me directly to get more details.
Contact Ulli