
ETF Tracker StatSheet
You can view the latest version here.
INFLATION FEARS PERSIST AS STAGFLATION LOOMS, YET MARKETS CLIMB HIGHER
- Moving the market
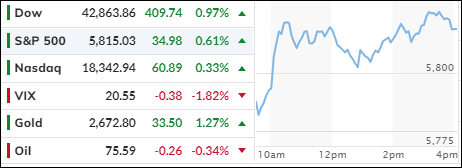
After undergoing a dip on Thursday, the major indexes regained upward momentum, with the S&P 500 not only achieving a fifth consecutive winning week but also setting a record.
However, the Nasdaq lagged, partly due to Tesla shares plummeting by approximately 7% following an underwhelming announcement about their “robotaxi.”
The start of the earnings season contributed to the positive market sentiment, as major banks exceeded profit and revenue expectations. HP Morgan advanced by 5%, while Wells Fargo surged around 6%.
The Producer Price Index (PPI) remained unchanged in September, contrary to the expected 0.1% increase, but it rose by 1.8% year-over-year, surpassing the 1.6% expectation. This temporarily alleviated some inflation concerns triggered by a higher-than-anticipated Consumer Price Index (CPI) increase. Consequently, traders are still anticipating two more 0.25% rate cuts this year.
However, medium-term inflation expectations increased, as reflected in the University of Michigan’s sentiment data for October, indicating that U.S. consumers are aware that inflation will persist in various aspects of life.
Additionally, the specter of stagflation has reemerged, with inflation rising and macroeconomic growth data declining. Despite these challenges, computer algorithms continued to drive stocks higher. Even the 10-year bond yield approaching 4.10% did not dampen bullish enthusiasm.
Heavily shorted stocks experienced significant short squeezes, while Chinese markets remained in turmoil due to government crackdowns, leading to an exodus of foreign investors.
Bond yields were mixed for the day, but the long end rose for the week. The dollar rallied for the second consecutive week but pulled back towards the close. Gold rebounded from Wednesday’s lows but fell short of its $2,700 target.
Crude oil traded sideways but managed to post a weekly gain. Bitcoin surged, reaching the $63,000 level.
Will Bitcoin continue to follow the direction of liquidity as shown in this chart?
2. Current “Buy” Cycles (effective 11/21/2023)
Our Trend Tracking Indexes (TTIs) have both crossed their trend lines with enough strength to trigger new “Buy” signals. That means, Tuesday, 11/21/2023, was the official date for these signals.
If you want to follow our strategy, you should first decide how much you want to invest based on your risk tolerance (percentage of allocation). Then, you should check my Thursday StatSheet and Saturday’s “ETFs on the Cutline” report for suitable ETFs to buy.
3. Trend Tracking Indexes (TTIs)
Despite the backdrop of rising inflation expectations and increasing bond yields, the markets experienced a notable upswing.
This surge was driven by both traders and computer algorithms, propelling the S&P 500 to a new record high.
In response, our TTIs also moved to a more bullish stance, contributing to the overall positive momentum in the market.
This is how we closed 10/11/2024:
Domestic TTI: +8.60% above its M/A (prior close +7.98%)—Buy signal effective 11/21/2023.
International TTI: +7.26% above its M/A (prior close +7.22%)—Buy signal effective 11/21/2023.
All linked charts above are courtesy of Bloomberg via ZeroHedge.
———————————————————-
WOULD YOU LIKE TO HAVE YOUR INVESTMENTS PROFESSIONALLY MANAGED?
Do you have the time to follow our investment plans yourself? If you are a busy professional who would like to have his portfolio managed using our methodology, please contact me directly to get more details.
Contact Ulli