
- Moving the market
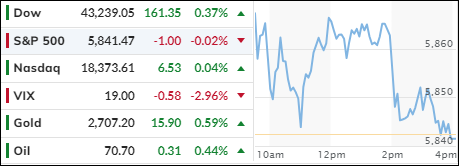
Semiconductor stocks were the driving force behind the major indexes’ early rise, with Nvidia reaching a new all-time high.
Taiwan Semiconductors contributed to the positive sentiment by not only reporting strong quarterly results but also raising its revenue forecasts. Other semiconductor companies, such as TSMC and AMD, also saw significant gains, erasing the previous day’s losses.
Despite the renewed interest in tech stocks, the indexes closed near their starting points, except for the Dow, which achieved a moderate gain and a record close.
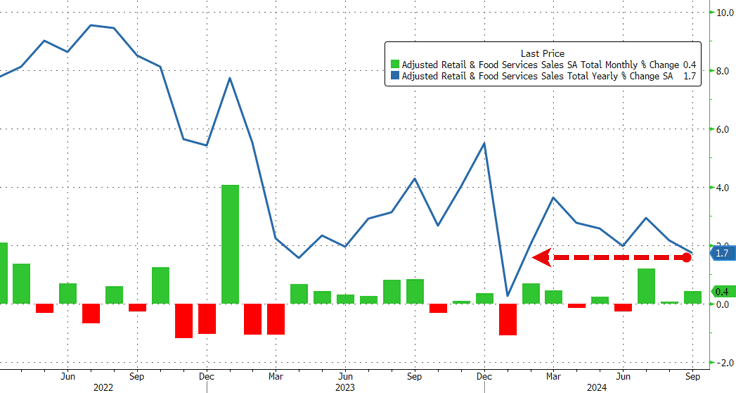
In economic news, retail sales data indicated that consumer spending continues to grow, with a 0.4% increase last month, surpassing the expected 0.3% forecast. However, after seasonal adjustments, the year-over-year growth slowed to 1.7%, the weakest since January.
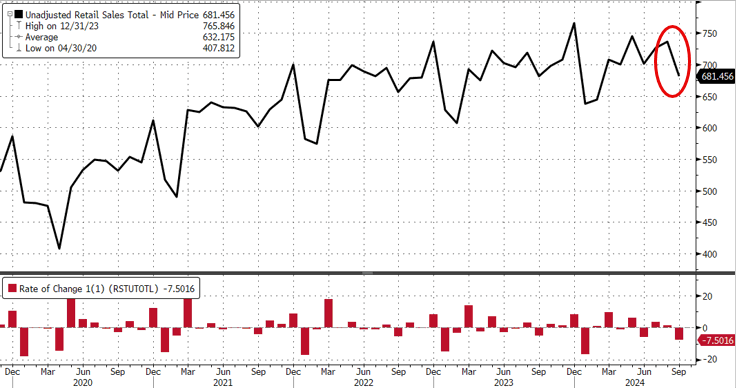
On an unadjusted basis, retail sales fell by a surprising 7.5% month-over-month, as highlighted by ZH. This discrepancy underscores the games that can be played with statistical adjustments.
Jobless claims for the week ending October 12 were lower, continuing a trend of positive labor market news throughout the year, although such figures are often subject to later revisions.
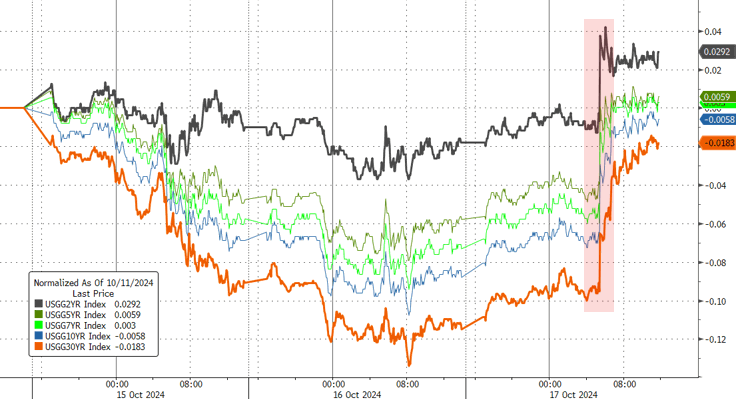
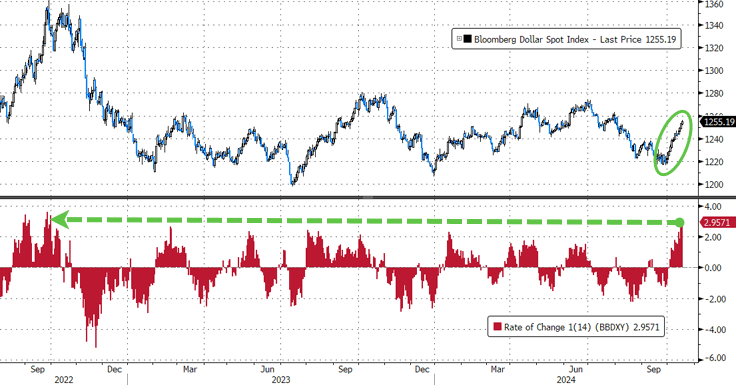
Bond yields reversed course and rose sharply, with the 10-year yield reaching 4.10% again. The dollar continued its upward trend, bolstered by rising rates, and has now advanced in 12 of the last 14 days.
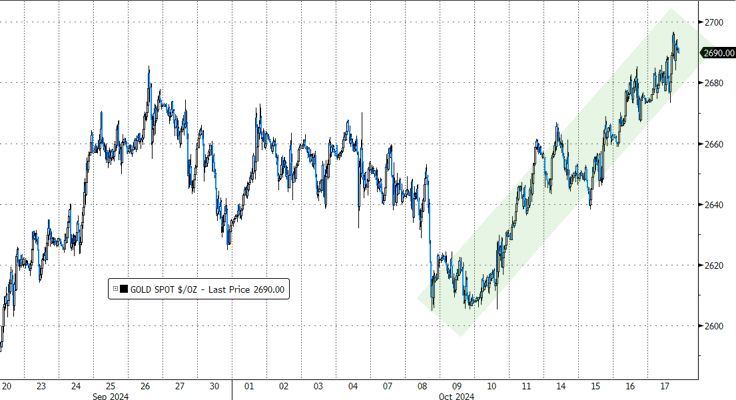
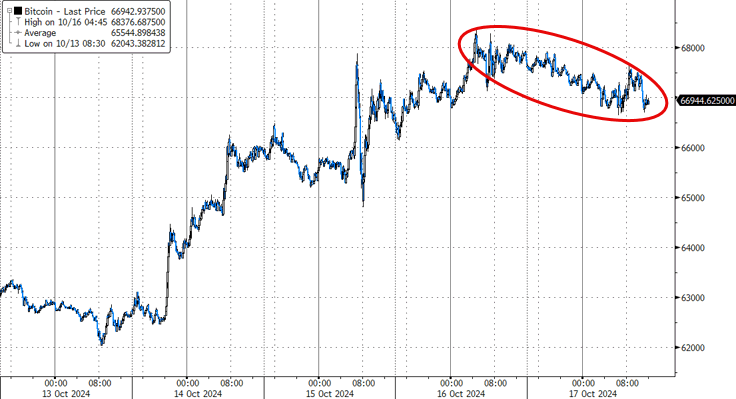
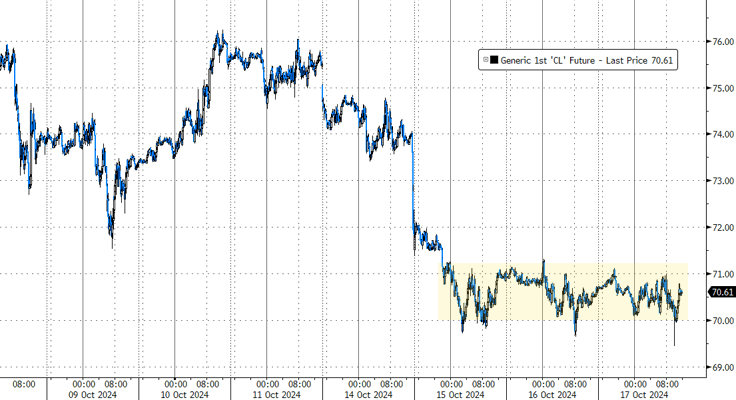
Despite this, gold rallied to another record high, while Bitcoin lost some momentum, retreating from the previous day’s $68,000 level. Oil prices remained steady within their three-day trading range.
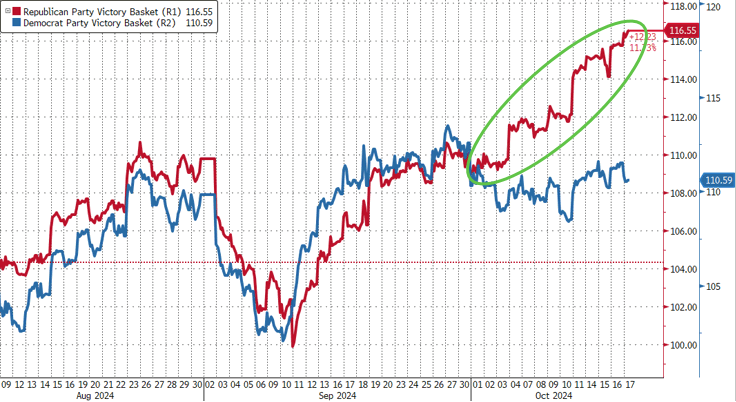
While forecasts are anything but certain, for the time being, the markets are pricing in a Trump victory, as this chart shows.
2. Current “Buy” Cycles (effective 11/21/2023)
Our Trend Tracking Indexes (TTIs) have both crossed their trend lines with enough strength to trigger new “Buy” signals. That means, Tuesday, 11/21/2023, was the official date for these signals.
If you want to follow our strategy, you should first decide how much you want to invest based on your risk tolerance (percentage of allocation). Then, you should check my Thursday StatSheet and Saturday’s “ETFs on the Cutline” report for suitable ETFs to buy.
3. Trend Tracking Indexes (TTIs)
Despite an initial surge, the S&P 500 and the Nasdaq struggled to maintain their upward momentum as the session progressed, ultimately closing near their starting points.
In contrast, the Dow managed to set a record, though its gain was minimal.
Overall, our TTIs showed only slight changes by the end of the trading day.
This is how we closed 10/17/2024:
Domestic TTI: +9.47% above its M/A (prior close +9.64%)—Buy signal effective 11/21/2023.
International TTI: +7.29% above its M/A (prior close +7.20%)—Buy signal effective 11/21/2023.
All linked charts above are courtesy of Bloomberg via ZeroHedge.
———————————————————-
WOULD YOU LIKE TO HAVE YOUR INVESTMENTS PROFESSIONALLY MANAGED?
Do you have the time to follow our investment plans yourself? If you are a busy professional who would like to have his portfolio managed using our methodology, please contact me directly to get more details.
Contact Ulli