
- Moving the market
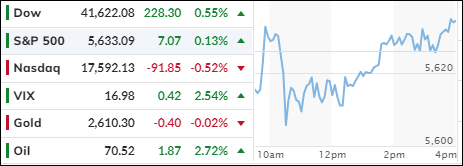
Early in the session, the Dow Jones reached record territory, but the S&P 500 and Nasdaq struggled to maintain their initial bullish momentum, with the Nasdaq slipping below its unchanged line.
Traders are eagerly awaiting one of the Federal Reserve’s most anticipated policy meetings, where the likelihood of the first rate cut since 2020 is nearly certain. The main question is the magnitude of the cut, with a 0.25% reduction almost guaranteed, while a 0.5% cut remains more speculative.
The Nasdaq fell by approximately 0.5%, driven by a decline in Apple shares due to longer shipping times and weaker demand for the iPhone 16 Pro models. Despite a challenging start to the month, the S&P 500 is less than 1% away from a new all-time high and could reach that level if the market reacts positively to the Fed’s announcement on Wednesday.
A rate cut is expected to support the struggling economy by lowering borrowing costs for companies, potentially boosting earnings growth and, in turn, economic growth and stock prices. However, history suggests that this outcome is not guaranteed.
As the Nasdaq declined, the MAG7 basket also moved lower, with Apple and Nvidia leading the losses, each dropping over 2%. Bond yields fell, with the 10-year yield closing at its lowest level since June 2023.
The dollar weakened, gold consolidated and ended nearly unchanged, while Bitcoin followed the tech sector’s trend, giving up some recent gains. Oil prices found support, rebounding from recent lows, and reclaiming the $70 level.
As we await the Fed’s interest rate decision, the 10-year yield and the Nasdaq are in a deep divergence. This raises the question: Who will lose this tug-of-war?
2. Current “Buy” Cycles (effective 11/21/2023)
Our Trend Tracking Indexes (TTIs) have both crossed their trend lines with enough strength to trigger new “Buy” signals. That means, Tuesday, 11/21/2023, was the official date for these signals.
If you want to follow our strategy, you should first decide how much you want to invest based on your risk tolerance (percentage of allocation). Then, you should check my Thursday StatSheet and Saturday’s “ETFs on the Cutline” report for suitable ETFs to buy.
3. Trend Tracking Indexes (TTIs)
In anticipation of the Federal Reserve’s decision on interest rates this Wednesday, the market remained confined within a narrow trading range. Despite this cautious atmosphere, the Dow and the S&P 500 managed to achieve modest gains. In contrast, the Nasdaq faced selling pressure and ended the session lower.
Interestingly, our TTIs showed divergence but ultimately closed the day on a positive note.
This is how we closed 09/16/2024:
Domestic TTI: +7.59% above its M/A (prior close +6.81%)—Buy signal effective 11/21/2023.
International TTI: +6.44% above its M/A (prior close +5.82%)—Buy signal effective 11/21/2023.
All linked charts above are courtesy of Bloomberg via ZeroHedge.
———————————————————-
WOULD YOU LIKE TO HAVE YOUR INVESTMENTS PROFESSIONALLY MANAGED?
Do you have the time to follow our investment plans yourself? If you are a busy professional who would like to have his portfolio managed using our methodology, please contact me directly to get more details.
Contact Ulli