
- Moving the market
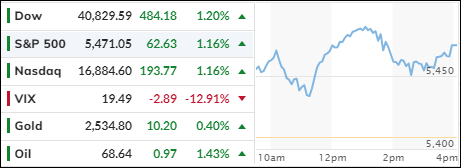
The markets began the session on a positive note, attempting to recover from last week’s steep losses. Although early upward momentum was briefly lost, bullish sentiment soon resumed, leading the major indexes to gain over 1% by the end of the day.
In the S&P sectors, technology and communications were the top performers, each advancing by over 1%. The Dow Jones Industrial Average was buoyed by gains in Boeing, American Express, and Caterpillar.
Last week’s sell-off resulted in significant losses for the major indexes, reminiscent of the downturn at the beginning of August. Despite the S&P 500’s 4.3% decline, our primary directional indicator, the Domestic Trend Tracking Index, remained above its long-term trend line, indicating continued bullish tendencies for now.
This market turmoil was largely driven by a slowing labor market and signs that the economy may not be as robust as previously thought, with layoffs and massive store closures dominating headlines for months.
This week, traders are focusing on the latest inflation data, with the consumer and producer price reports (CPI/PPI) due out on Wednesday and Thursday. These reports will be crucial and could influence the Federal Reserve’s decision on interest rates later this month. Currently, there is a 71% chance that the Fed will cut rates by 0.25%, and a 29% chance of a 0.50% cut.
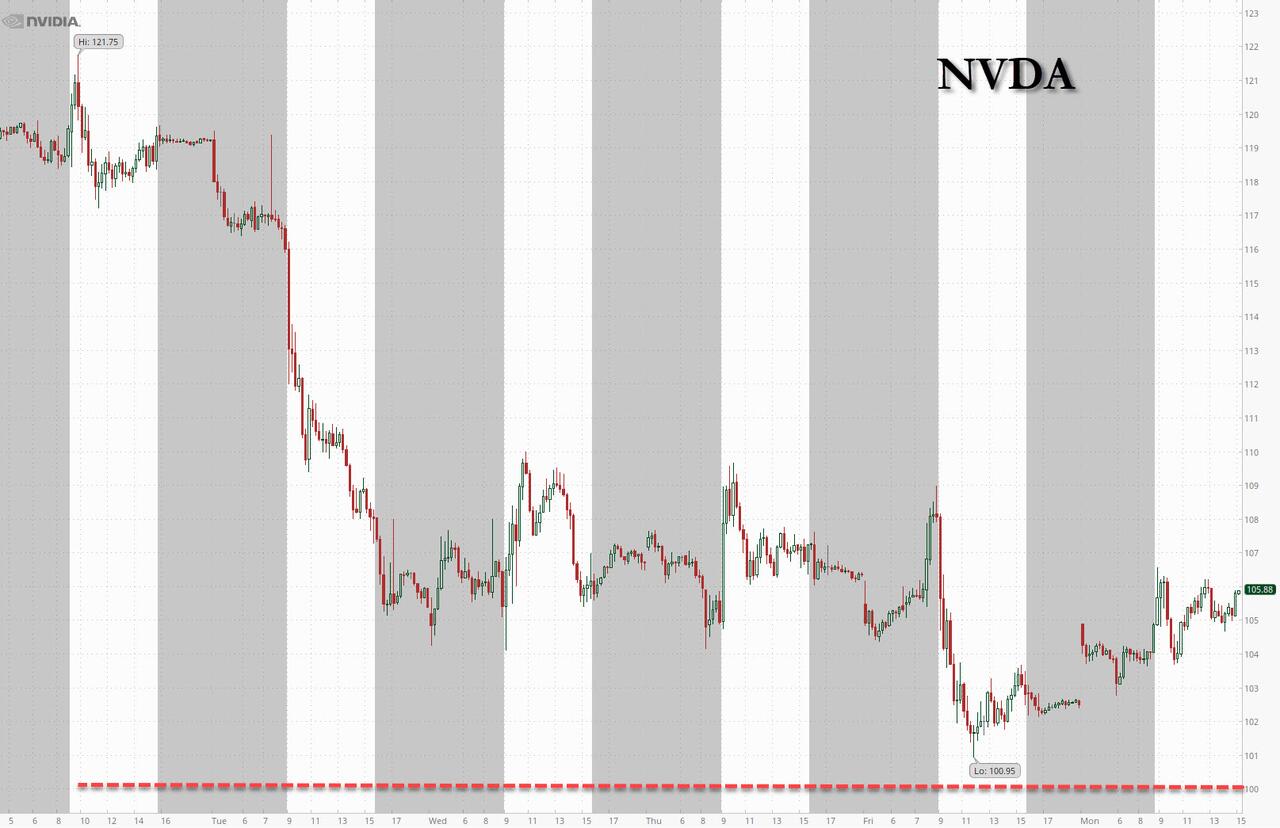
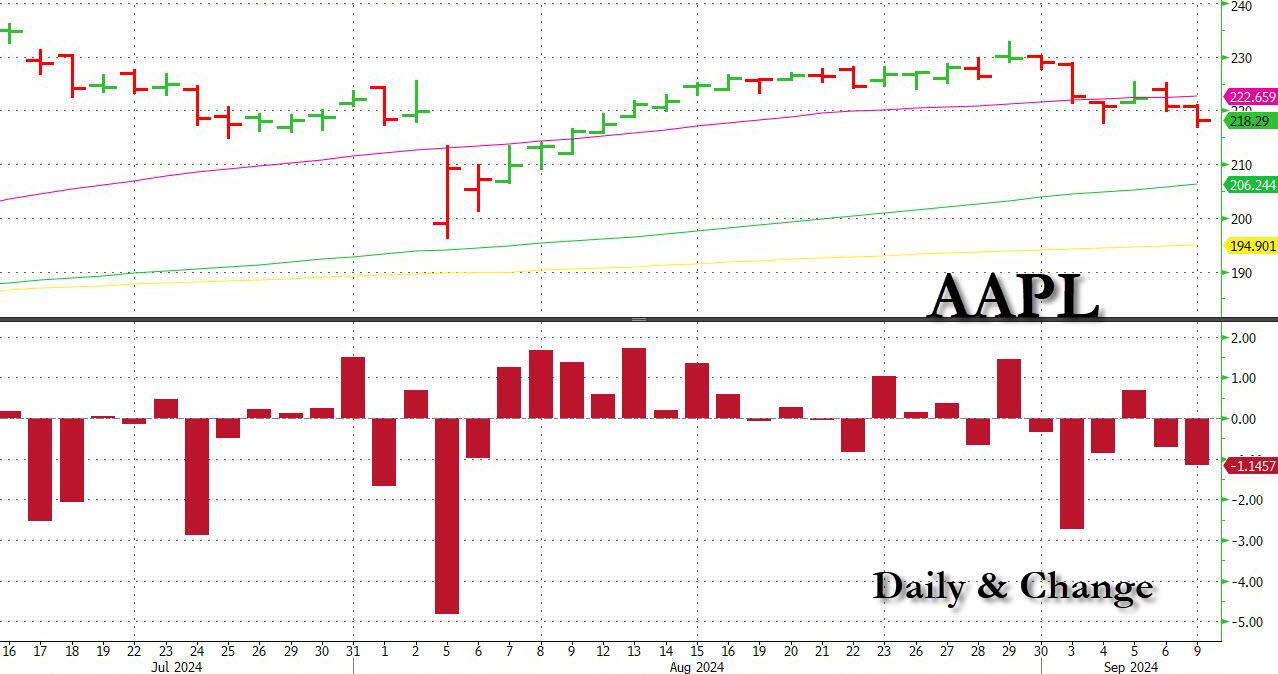
Nvidia continued its rebound from the critical $100 level, while Google slipped another 3%, marking its fourth loss in the past five days. Apple’s new iPhone 16 was largely seen as a disappointment, causing the stock to drop for the fifth time in the last six sessions.
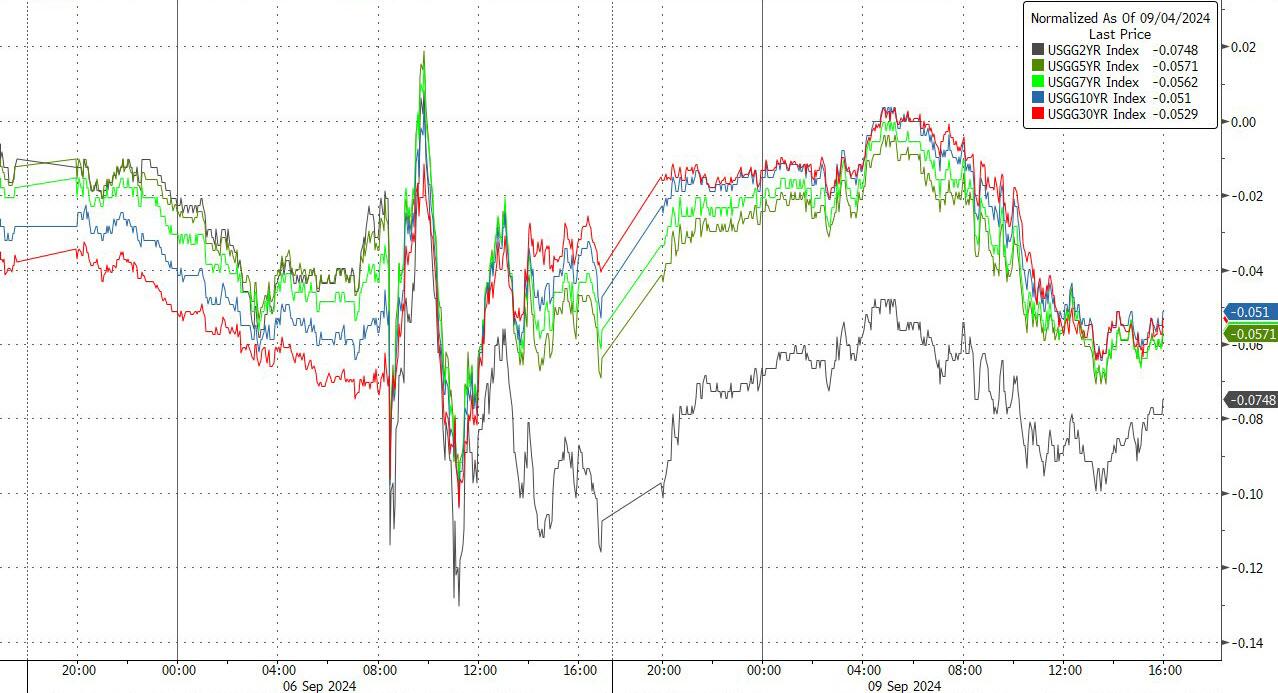
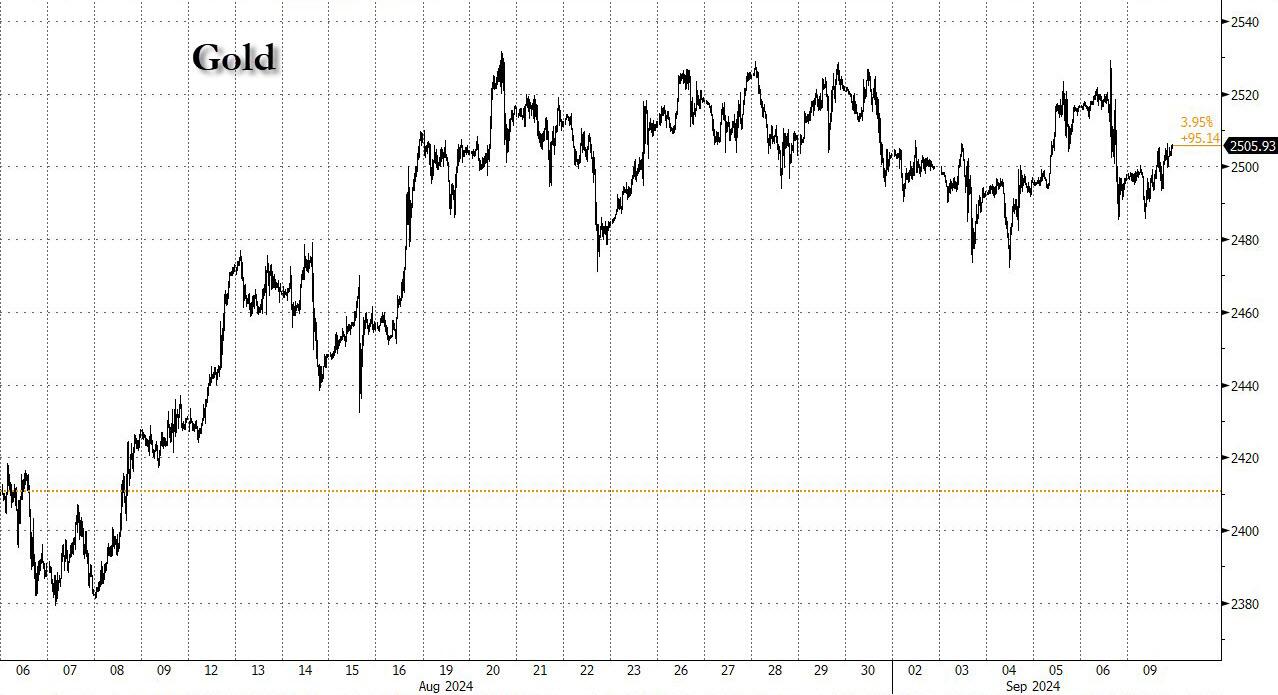
Bond yields dipped slightly, gold rebounded and is now trading close to its all-time high. Bitcoin’s ARKB ETF gained significant momentum, surging by 6.85%, a welcome recovery after recent weakness.
Was today merely a dead cat bounce, or will this recovery attempt continue?
2. Current “Buy” Cycles (effective 11/21/2023)
Our Trend Tracking Indexes (TTIs) have both crossed their trend lines with enough strength to trigger new “Buy” signals. That means, Tuesday, 11/21/2023, was the official date for these signals.
If you want to follow our strategy, you should first decide how much you want to invest based on your risk tolerance (percentage of allocation). Then, you should check my Thursday StatSheet and Saturday’s “ETFs on the Cutline” report for suitable ETFs to buy.
3. Trend Tracking Indexes (TTIs)
Despite some fluctuations throughout the day, the markets ultimately upheld their bullish sentiment, with the major indexes closing significantly higher.
This positive trend was mirrored by our TTIs, which also showed a strong performance by increasing their distance from their respective trend lines.
This is how we closed 09/09/2024:
Domestic TTI: +5.37% above its M/A (prior close +4.36%)—Buy signal effective 11/21/2023.
International TTI: +4.58% above its M/A (prior close +4.01%)—Buy signal effective 11/21/2023.
All linked charts above are courtesy of Bloomberg via ZeroHedge.
———————————————————-
WOULD YOU LIKE TO HAVE YOUR INVESTMENTS PROFESSIONALLY MANAGED?
Do you have the time to follow our investment plans yourself? If you are a busy professional who would like to have his portfolio managed using our methodology, please contact me directly to get more details.
Contact Ulli