
- Moving the market
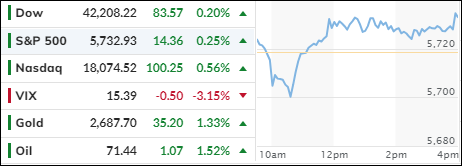
The markets experienced early volatility due to a sharp drop in the September Consumer Confidence Index, which pressured stocks. However, by the end of the day, the major indexes managed to close moderately higher.
The Consumer Confidence Index fell to 98.7, significantly below the revised August reading of 105.6 and marking its lowest level in three years. Analysts had expected a reading of 104.
Given that consumer activity accounts for approximately 67% of overall economic activity, this decline confirms worsening economic conditions and suggests that we have already entered a recession. This is why the Federal Reserve implemented a more aggressive 0.5% interest rate cut last week, rather than the anticipated 0.25%. To me, their actions represented an emergency measure.
While traders welcomed the Fed’s aggressive stance, I anticipate increased volatility and a potential disruption of the bullish trend in the coming months. Keep an eye on our Trend Tracking Indexes (section 3) for further developments.
China introduced a series of economic stimulus measures, including rate cuts, which positively impacted their stock market. However, the US and European markets showed little reaction.
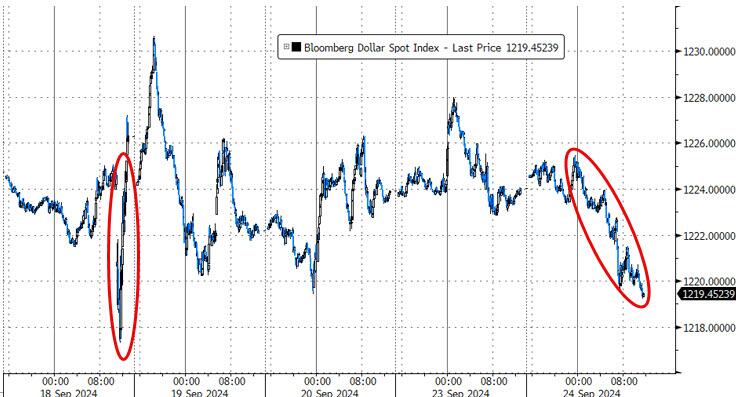
The dollar weakened, Bloomberg’s Business Cycle Indicator declined sharply, and expectations for three more rate cuts in 2024 increased.
Gold gained 1.36%, approaching the $2,700 level. The most shorted stocks experienced wild swings but ended unchanged, bond yields retreated from mid-session highs, and crude oil recovered from the previous day’s drop.
Bitcoin moved towards $64,000, the upper end of its recent trading range.
With China’s recent monetary stimulus and global liquidity now comparable to the S&P 500, can we expect further upside potential, possibly leading to a blow-off top?
2. Current “Buy” Cycles (effective 11/21/2023)
Our Trend Tracking Indexes (TTIs) have both crossed their trend lines with enough strength to trigger new “Buy” signals. That means, Tuesday, 11/21/2023, was the official date for these signals.
If you want to follow our strategy, you should first decide how much you want to invest based on your risk tolerance (percentage of allocation). Then, you should check my Thursday StatSheet and Saturday’s “ETFs on the Cutline” report for suitable ETFs to buy.
3. Trend Tracking Indexes (TTIs)
Although the markets began the day sluggishly, a wave of bullish sentiment eventually lifted the major indexes, allowing them to close with modest gains.
Similarly, our TTIs mirrored this upward trend, with the international TTI outperforming its domestic counterpart.
This is how we closed 09/24/2024:
Domestic TTI: +8.25% above its M/A (prior close +8.05%)—Buy signal effective 11/21/2023.
International TTI: +8.05% above its M/A (prior close +7.13%)—Buy signal effective 11/21/2023.
All linked charts above are courtesy of Bloomberg via ZeroHedge.
———————————————————-
WOULD YOU LIKE TO HAVE YOUR INVESTMENTS PROFESSIONALLY MANAGED?
Do you have the time to follow our investment plans yourself? If you are a busy professional who would like to have his portfolio managed using our methodology, please contact me directly to get more details.
Contact Ulli