
ETF Tracker StatSheet
You can view the latest version here.
GOLD HITS NEW RECORD HIGH, BITCOIN RALLIES TO 1-MONTH HIGHS
- Moving the market
After yesterday’s significant rally, which followed Wednesday’s sudden midday reversal, the markets cooled off today, entering a consolidation phase due to the largest September option expiration on record.
Despite traders’ enthusiasm about the Fed’s aggressive 0.5% rate cut, marking a reversal in interest rate policy, volatility is likely to persist amid ongoing uncertainty about economic conditions, the new easing cycle, and the upcoming elections.
In corporate news, FedEx’s shares plummeted 13% after the company slashed its full-year earnings outlook and revenue guidance, signaling economic challenges. Conversely, Nike surged 7.5% on the announcement that its current CEO will step down.
Despite today’s modest pullback, the major indexes remain near record levels, as do home prices, alongside improvements in macroeconomic data. The Fed has confirmed the economy’s strength and anticipates a soft landing. However, their latest policy decision suggests a crisis, creating more questions than answers.
The most shorted stocks roundtripped, while the MAG7 basket continued to face overhead resistance. Utilities outperformed, with XLU gaining an impressive 2.65% for the day.
Bond yields were mixed for the week, with the 10-year yield inching higher. The dollar ended unchanged, while crude oil rebounded from its 3-year lows.
Bitcoin performed well over the last five trading days, rallying towards $64k and closing at 1-month highs. Gold soared to a new record high today, with the precious metal eyeing the $3k level.
As I have repeatedly noted, increasing inflation remains a significant concern, raising questions about whether we might revisit the economic turmoil of the 1970s.
2. Current “Buy” Cycles (effective 11/21/2023)
Our Trend Tracking Indexes (TTIs) have both crossed their trend lines with enough strength to trigger new “Buy” signals. That means, Tuesday, 11/21/2023, was the official date for these signals.
If you want to follow our strategy, you should first decide how much you want to invest based on your risk tolerance (percentage of allocation). Then, you should check my Thursday StatSheet and Saturday’s “ETFs on the Cutline” report for suitable ETFs to buy.
3. Trend Tracking Indexes (TTIs)
The stock market was heavily influenced by the largest September option expiration on record. Throughout the session, the major indexes struggled to maintain their positions near their respective unchanged lines.
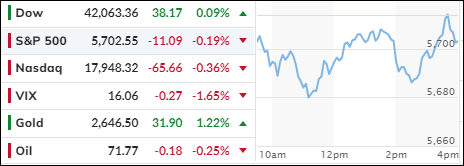
By the end of the day, the Dow managed to eke out a slight gain, while the S&P 500 and the Nasdaq experienced moderate declines.
Similarly, our TTIs meandered and ultimately closed with fractional losses.
This is how we closed 09/20/2024:
Domestic TTI: +7.93% above its M/A (prior close +8.69%)—Buy signal effective 11/21/2023.
International TTI: +6.83% above its M/A (prior close +7.54%)—Buy signal effective 11/21/2023.
All linked charts above are courtesy of Bloomberg via ZeroHedge.
———————————————————-
WOULD YOU LIKE TO HAVE YOUR INVESTMENTS PROFESSIONALLY MANAGED?
Do you have the time to follow our investment plans yourself? If you are a busy professional who would like to have his portfolio managed using our methodology, please contact me directly to get more details.
Contact Ulli