
- Moving the market
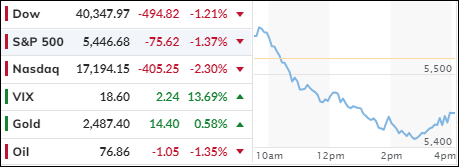
The markets faced a significant downturn today, as weak economic data erased an early rally. Major indexes dipped into the red, with the Nasdaq dropping 2.3%, effectively wiping out most of yesterday’s gains.
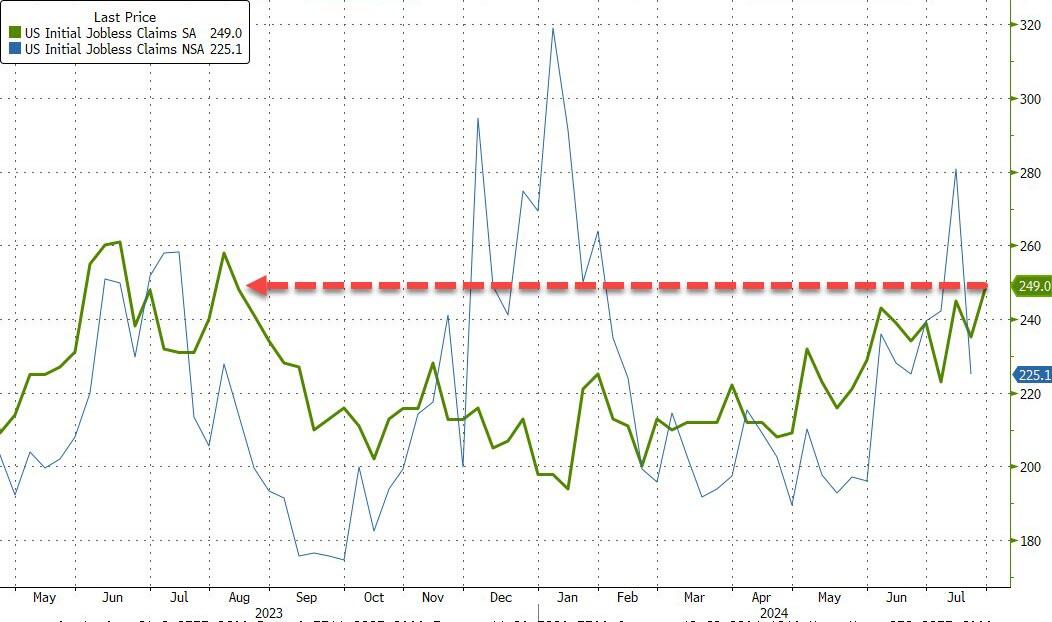
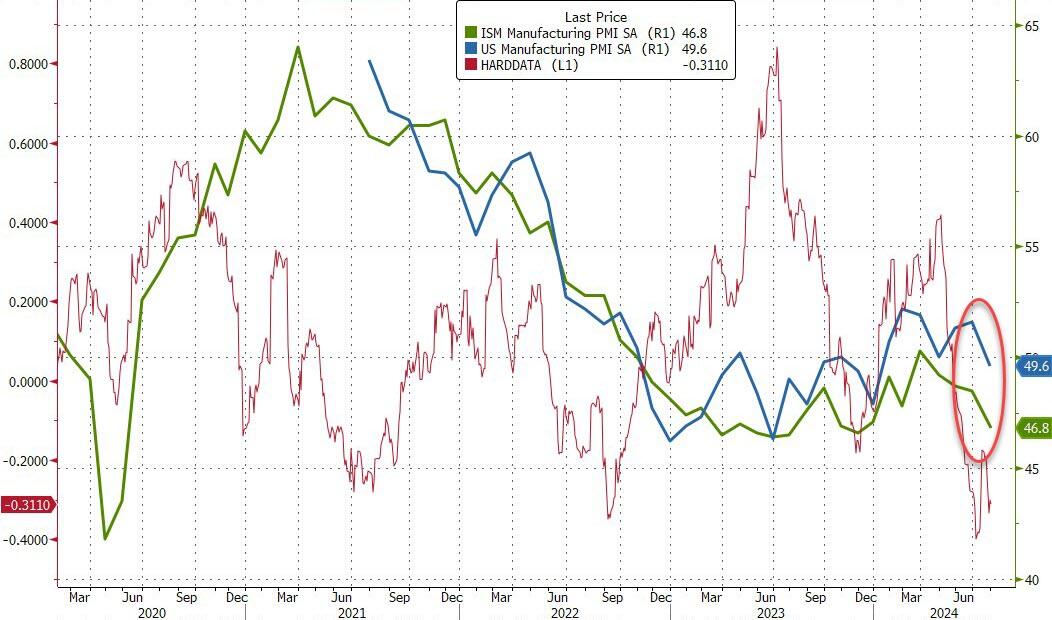
Initial jobless claims surged to 249,000 for the week ending July 27, surpassing the estimated 235,000. Additionally, the ISM manufacturing index, which reflects economic activity, fell to 46.8, reinforcing my view that the economy is slowing down. In summary, today’s bad news was genuinely bad for the markets, unlike previous instances where bad news sometimes had a positive effect.
Although the Federal Reserve left interest rates unchanged yesterday, this type of data might prompt the central bank to lower rates at their September meeting. However, if inflation remains uncontained, despite traders’ beliefs, the Fed could face a challenging situation, potentially leading to stagflation.
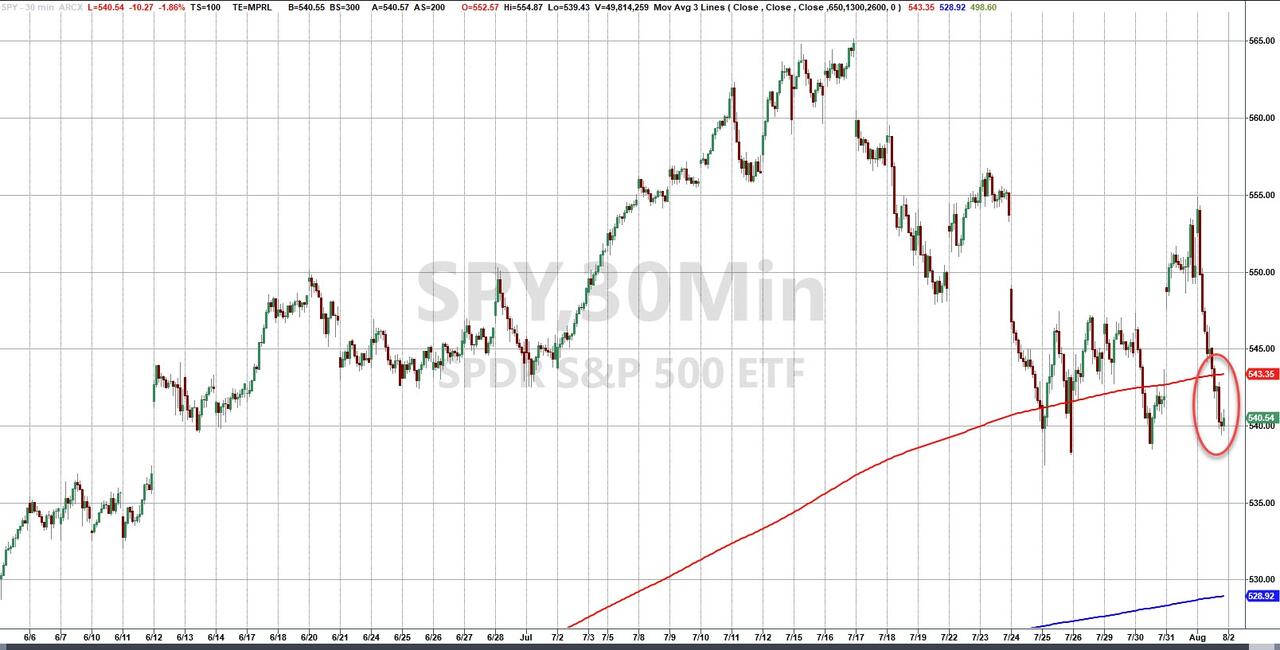
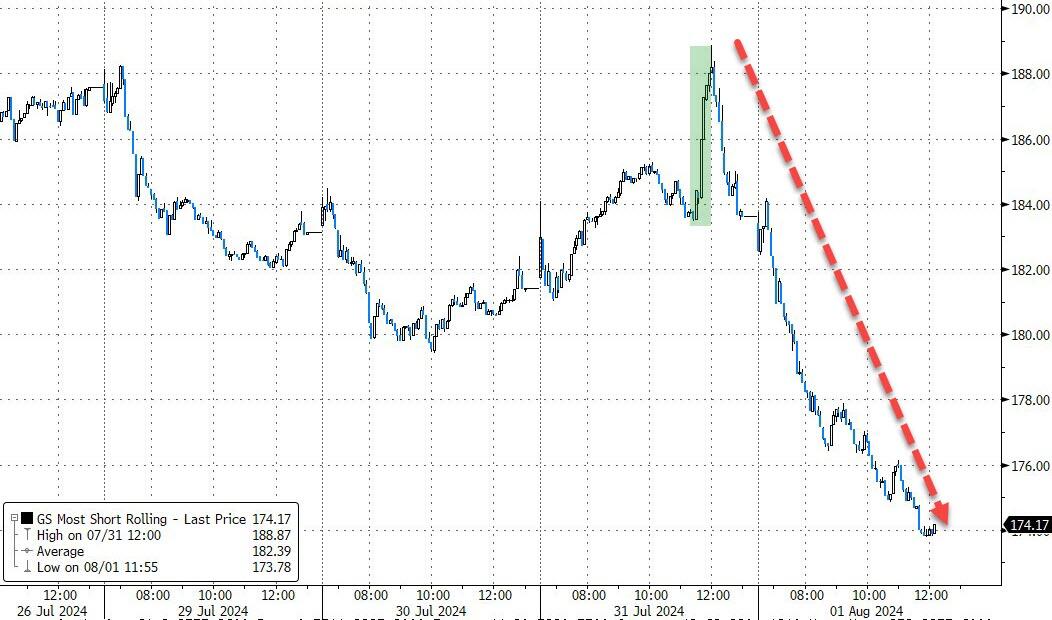
The S&P 500 experienced a sharp decline, losing its 50-day moving average and marking its worst start to August since 2002. Yesterday’s beneficial short squeeze disappeared, with the most shorted stocks plummeting 8% from yesterday’s highs, as noted by ZH.
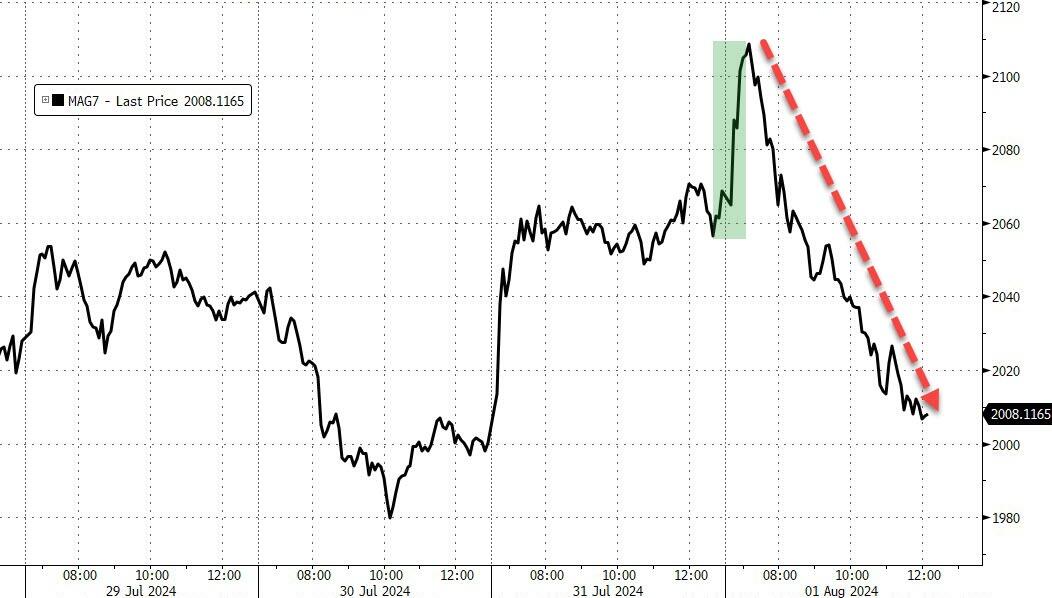
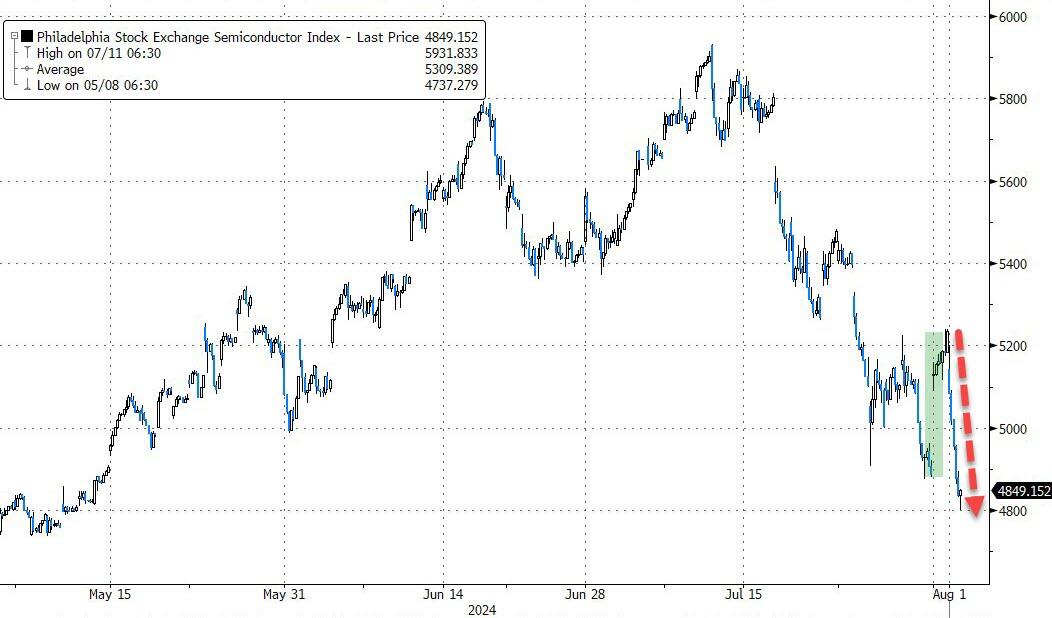
The MAG7 stocks saw a dramatic reversal, with an early morning 2.5% gain turning into a nearly 5% drop, erasing $430 billion in market cap. Semiconductors followed this trend, hitting their May lows.
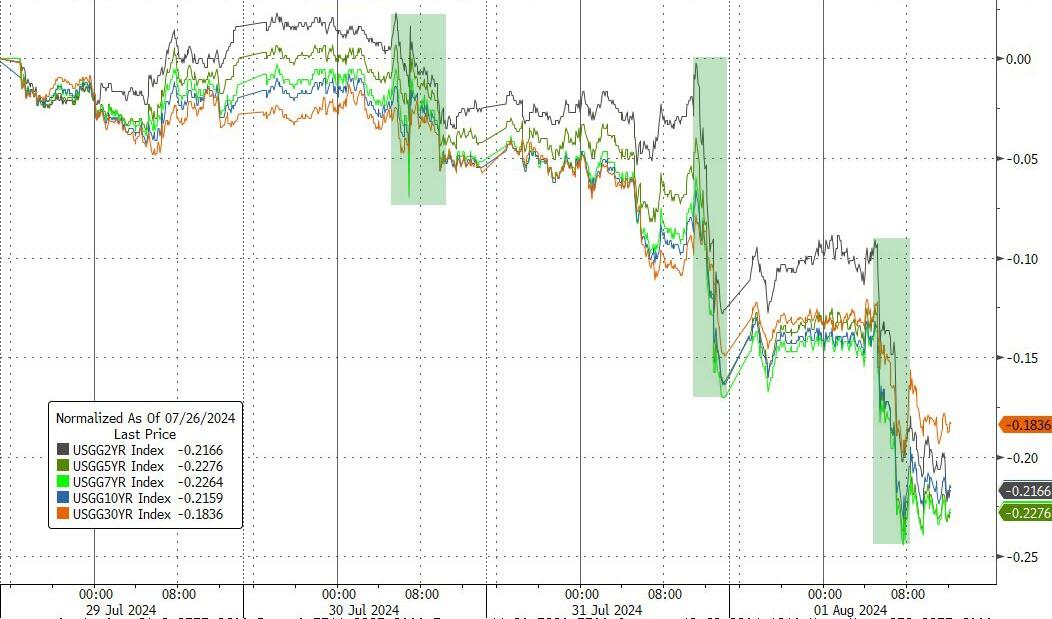
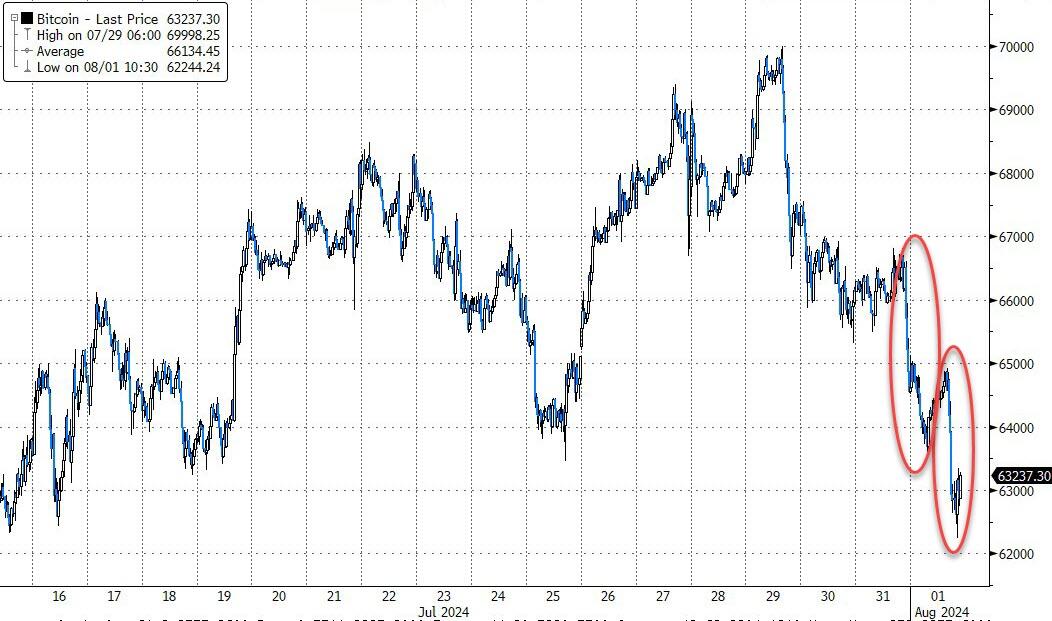
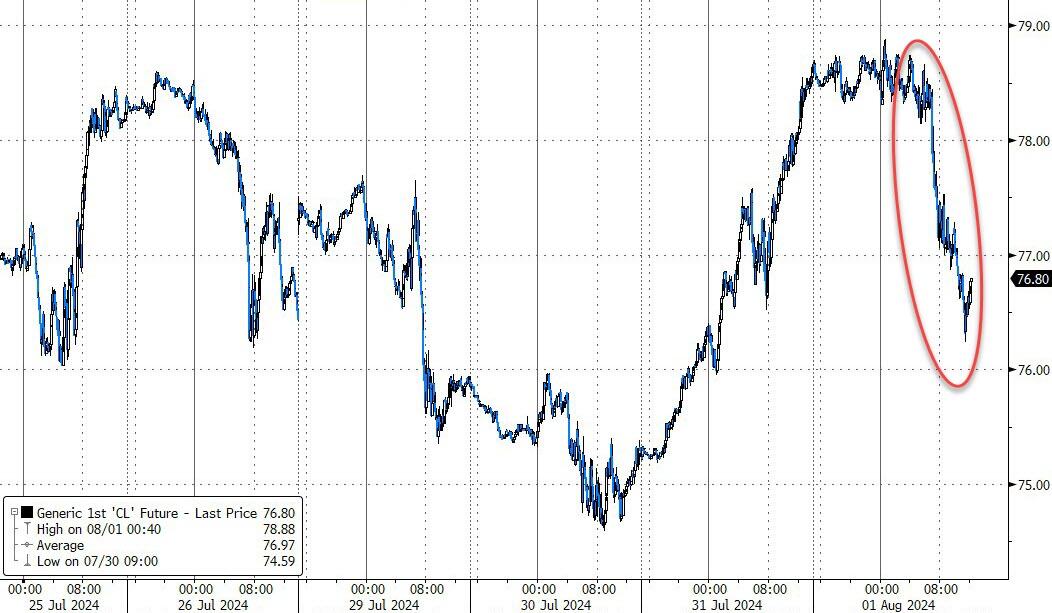
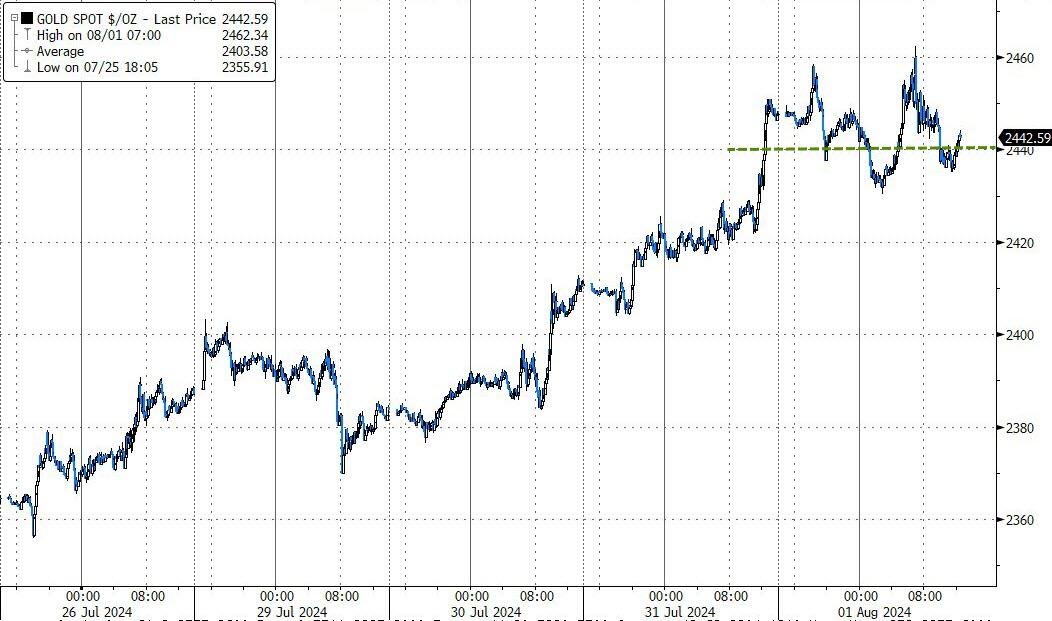
Unsurprisingly, bond yields fell, Bitcoin tested its $63,000 level, crude oil prices dropped after initially rising due to Middle East tensions, while gold remained steady.
With volatility on the rise, tomorrow’s jobs report and Amazon’s earnings could further confirm an economic downturn.
2. Current “Buy” Cycles (effective 11/21/2023)
Our Trend Tracking Indexes (TTIs) have both crossed their trend lines with enough strength to trigger new “Buy” signals. That means, Tuesday, 11/21/2023, was the official date for these signals.
If you want to follow our strategy, you should first decide how much you want to invest based on your risk tolerance (percentage of allocation). Then, you should check my Thursday StatSheet and Saturday’s “ETFs on the Cutline” report for suitable ETFs to buy.
3. Trend Tracking Indexes (TTIs)
The markets experienced a brief early rally, but this initial optimism was quickly overturned. As bullish sentiment evaporated, the major indexes reversed course and declined sharply.
This downturn also impacted our TTIs, which surrendered a portion of the gains they had achieved the previous day.
This is how we closed 08/01/2024:
Domestic TTI: +6.56% above its M/A (prior close +7.76%)—Buy signal effective 11/21/2023.
International TTI: +5.36% above its M/A (prior close +7.09%)—Buy signal effective 11/21/2023.
All linked charts above are courtesy of Bloomberg via ZeroHedge.
———————————————————-
WOULD YOU LIKE TO HAVE YOUR INVESTMENTS PROFESSIONALLY MANAGED?
Do you have the time to follow our investment plans yourself? If you are a busy professional who would like to have his portfolio managed using our methodology, please contact me directly to get more details.
Contact Ulli