
ETF Tracker StatSheet
You can view the latest version here.
INVESTOR VOLATILITY: EQUITIES UNLOADED AS MONEY MARKET ASSETS HIT RECORD HIGH
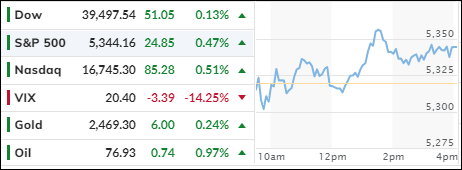
- Moving the market
After yesterday’s strong comeback session, upward momentum slowed, but traders and algorithms continued to push the indexes higher, erasing most losses from earlier in the week.
This recovery followed Monday’s steep global sell-off, triggered by three key events: last Friday’s disappointing jobs data, uncertainty about the Fed’s anticipated rate-cutting timeline, and the unwinding of the Japanese yen carry trade.
Despite these efforts, the major indexes remain below last Friday’s close, though by a much smaller margin than a few days ago. Consequently, the S&P 500 and the Nasdaq have now recorded their fourth consecutive losing week.
Historically, equities have benefited from the “bad news is good news” scenario, where negative economic news increased the likelihood of the Fed loosening its grip on rates. However, this dynamic seems to have shifted, as the economy has weakened, and bad news now negatively impacts the markets. It appears that positive news is now necessary for equities to move higher.
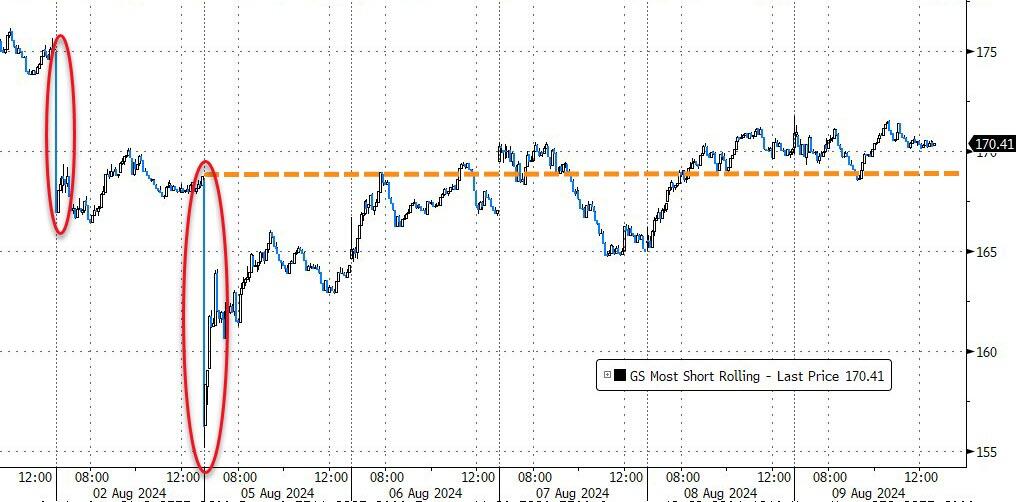
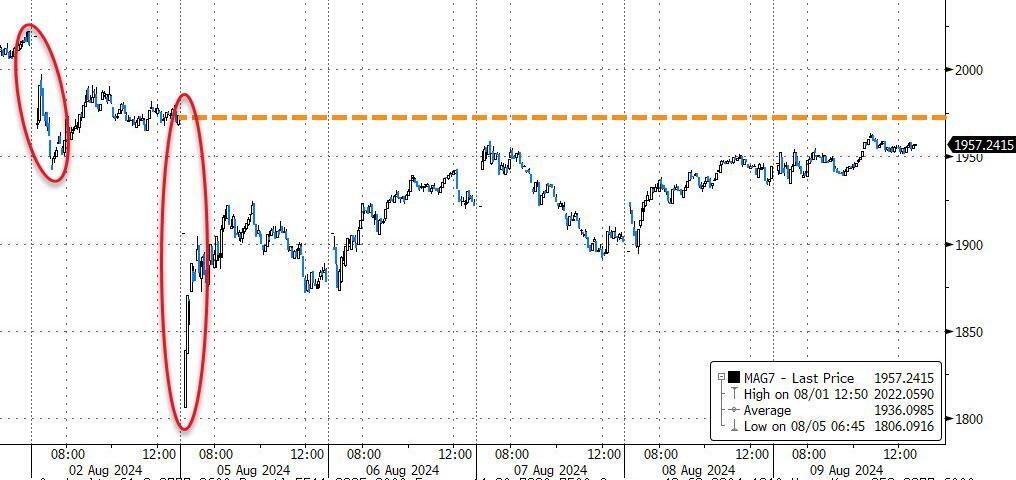
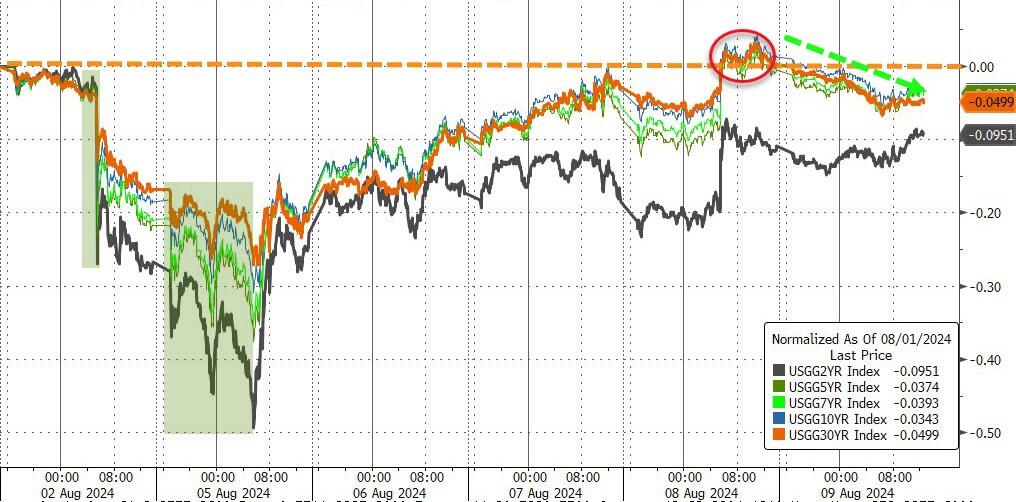
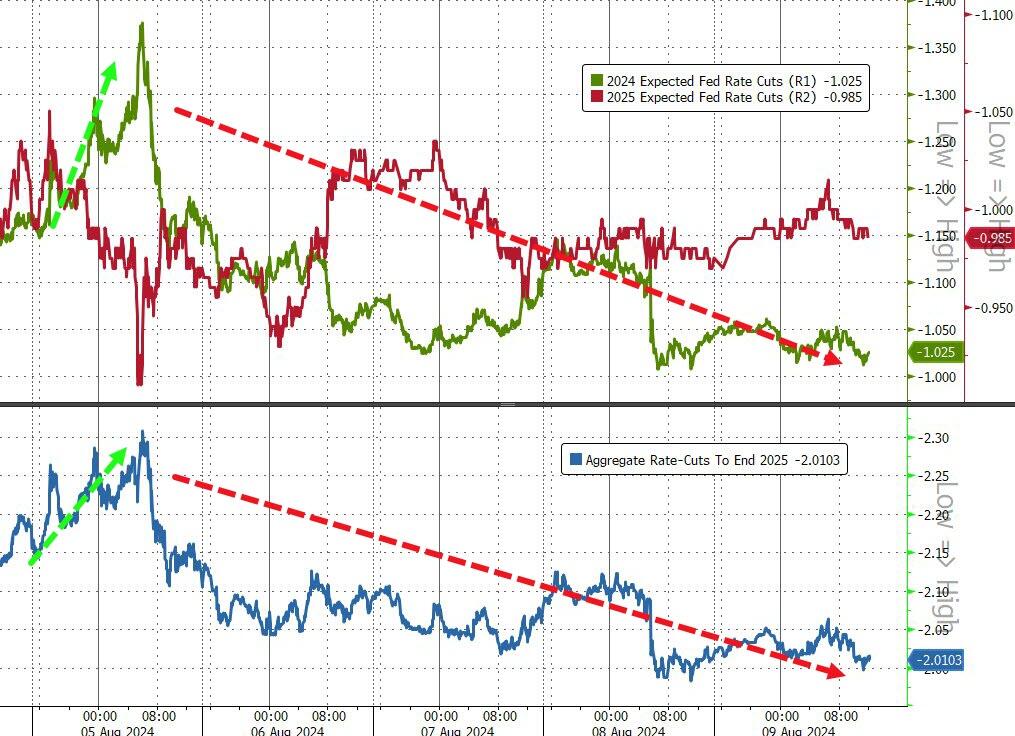
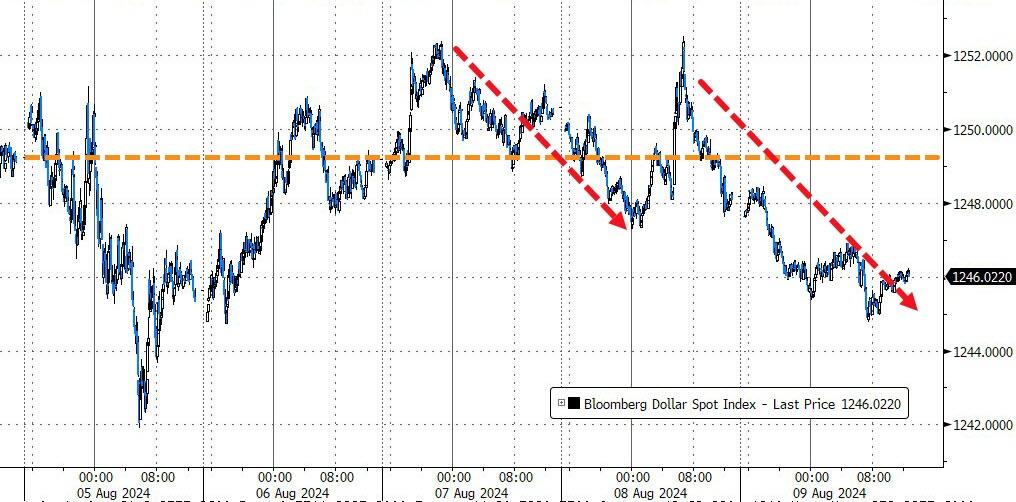
The most shorted stocks were squeezed higher after Monday’s collapse, while the MAG7 basket, after dropping 8%, entered recovery mode but did not reach the breakeven point. Bond yields fluctuated but ended higher, rate-cut expectations fell after Monday’s surge, and the dollar slipped.
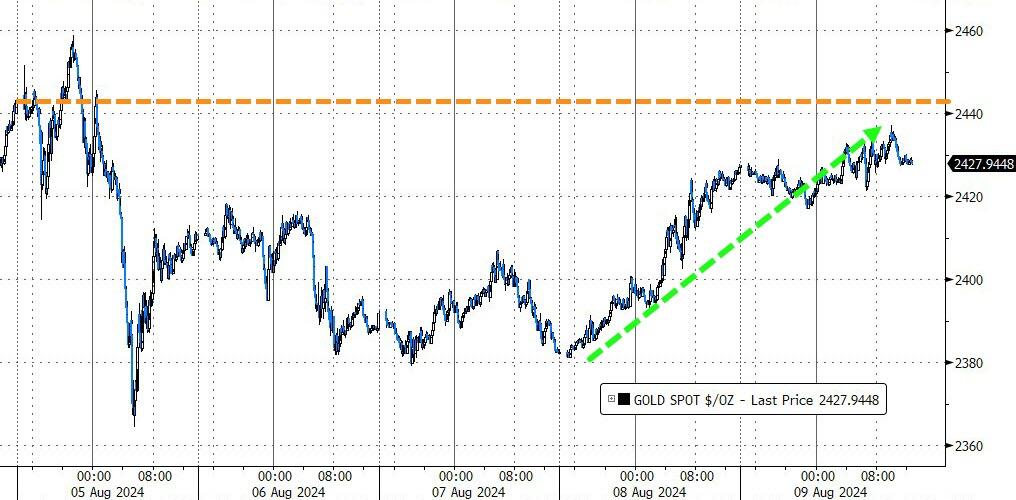
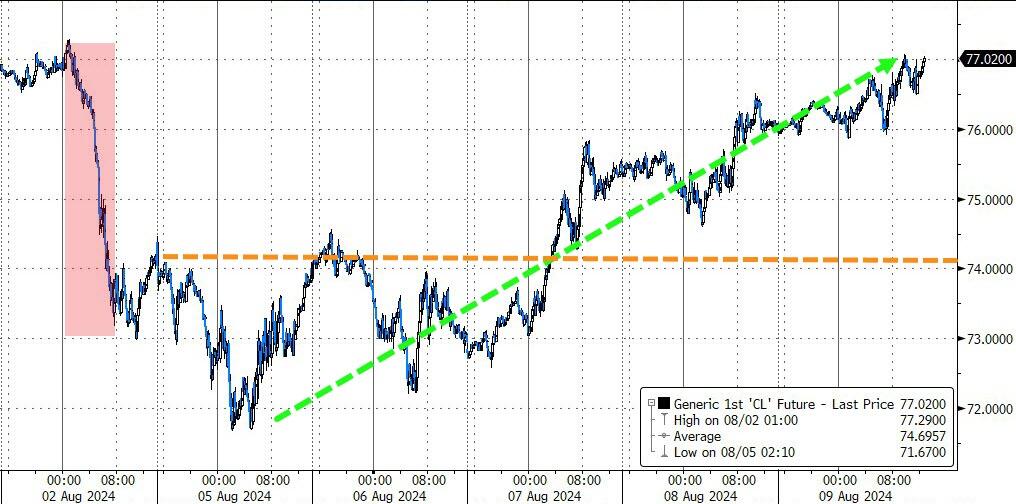
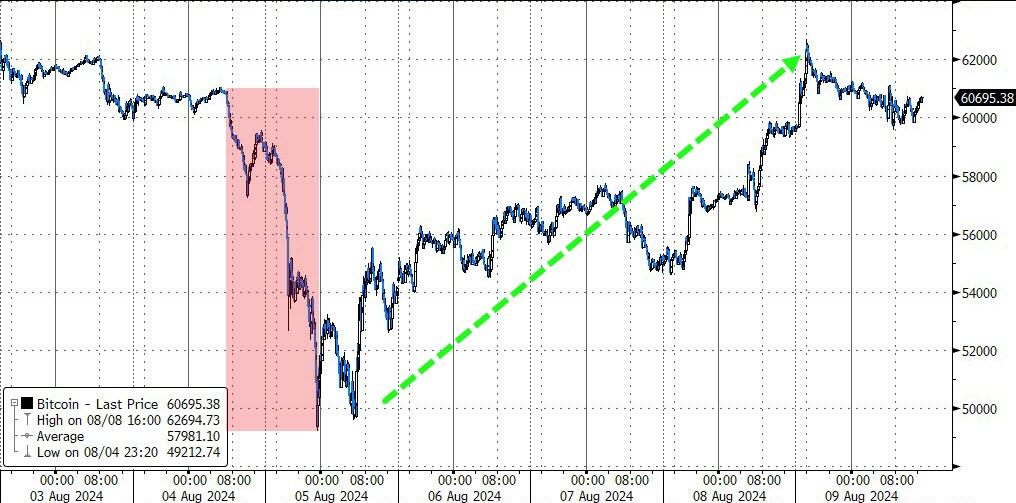
Gold rebounded over the last two days, recapturing its $2,400 level but closed slightly lower for the week. Oil prices dipped and then rebounded to their $77 level from a low of $72, while Bitcoin experienced a volatile week, initially plunging but then recovering towards the $62k level.
This volatility clearly took a toll on investors, who unloaded equities and sent total money market assets to a new record high. In the current economic environment, taking some chips off the table seems wise.
However, we’ll have to wait and see if the adage “he who panics first, panics best” will hold true once again.
2. Current “Buy” Cycles (effective 11/21/2023)
Our Trend Tracking Indexes (TTIs) have both crossed their trend lines with enough strength to trigger new “Buy” signals. That means, Tuesday, 11/21/2023, was the official date for these signals.
If you want to follow our strategy, you should first decide how much you want to invest based on your risk tolerance (percentage of allocation). Then, you should check my Thursday StatSheet and Saturday’s “ETFs on the Cutline” report for suitable ETFs to buy.
3. Trend Tracking Indexes (TTIs)
Despite the bulls maintaining control in the market today, their efforts were not enough to prevent the S&P 500 from marking its fourth consecutive losing week.
Our TTIs mirrored the bullish sentiment from yesterday, closing higher once again. This positive movement came after the TTIs had approached a potential “Sell” signal just last Monday.
This is how we closed 08/09/2024:
Domestic TTI: +3.74% above its M/A (prior close +3.56%)—Buy signal effective 11/21/2023.
International TTI: +2.26% below its M/A (prior close +1.80%)—Buy signal effective 11/21/2023.
All linked charts above are courtesy of Bloomberg via ZeroHedge.
———————————————————-
WOULD YOU LIKE TO HAVE YOUR INVESTMENTS PROFESSIONALLY MANAGED?
Do you have the time to follow our investment plans yourself? If you are a busy professional who would like to have his portfolio managed using our methodology, please contact me directly to get more details.
Contact Ulli