
ETF Tracker StatSheet
You can view the latest version here.
STOCK MARKET FACES TURBULENCE: IS A RECESSION ON THE HORIZON?
- Moving the market
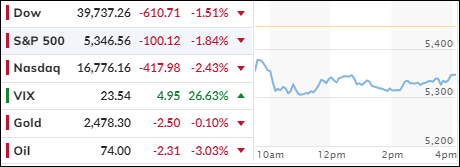
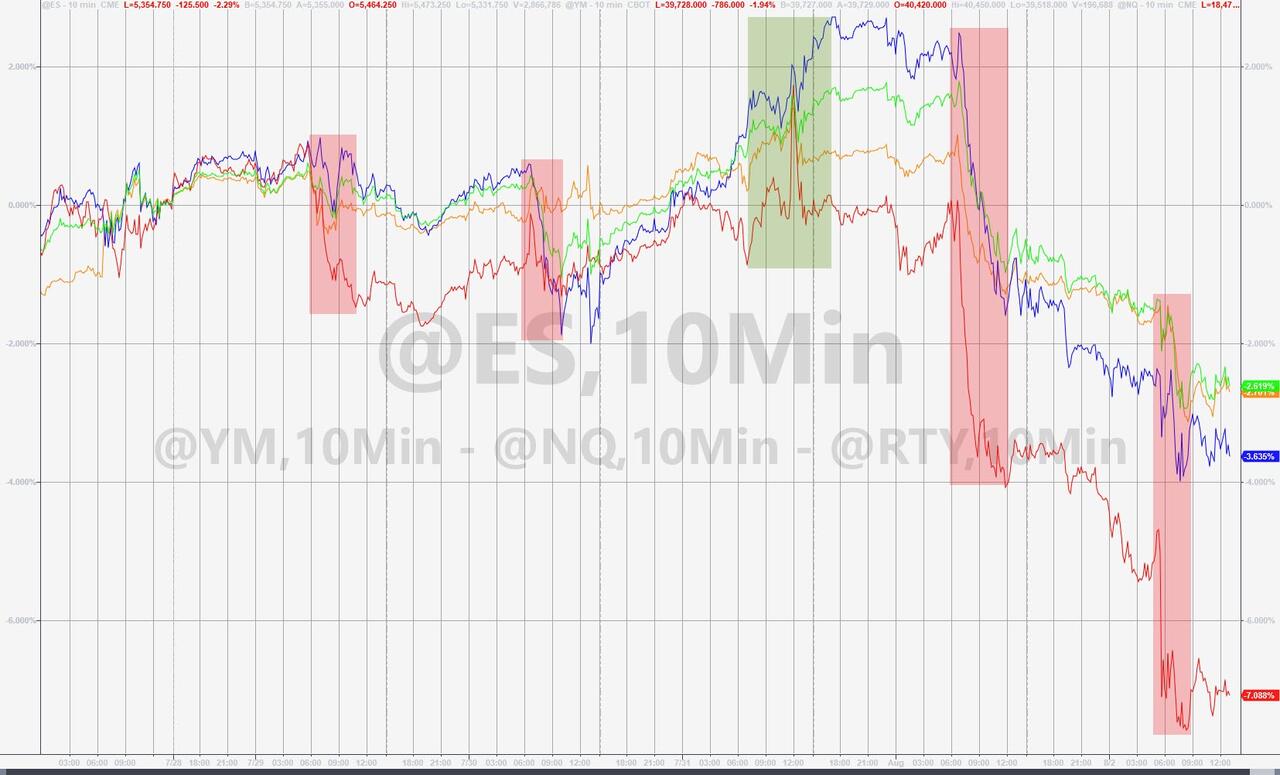
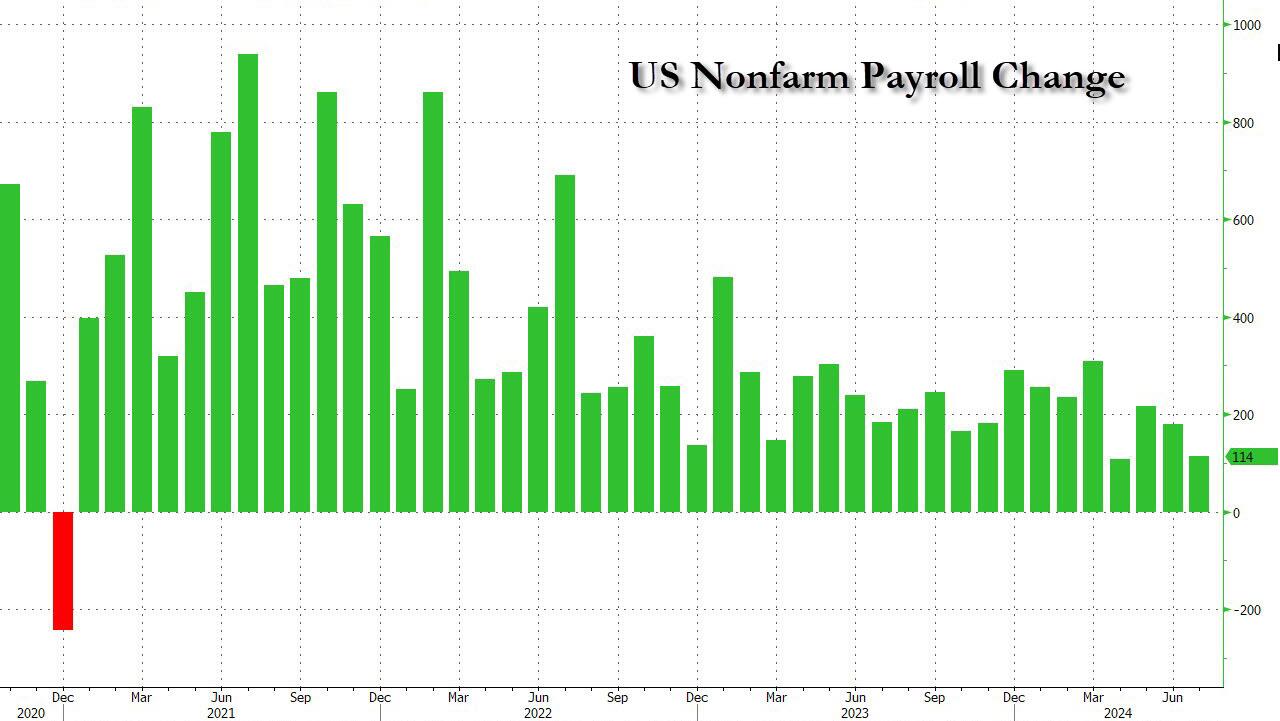
The markets suffered a significant downturn this morning, driven by a weaker-than-expected July jobs report that dampened any bullish sentiment. Nonfarm payroll jobs increased by only 114,000 last month, a sharp decline from the 179,000 jobs added in June and well below the expected 185,000 gain. Adding to the market’s woes, the unemployment rate rose to 4.3%.
Further exacerbating the situation, Amazon missed its second-quarter revenue targets and issued a disappointing outlook, causing its stock to plummet by 9%. Intel fared even worse, with its stock price dropping by 26% following weak guidance and announcements of layoffs. Apple saw a slight decline, while Nvidia fell by 2% after a 6% drop the previous day. The looming threat of a recession became more pronounced, impacting stocks most vulnerable to economic downturns.
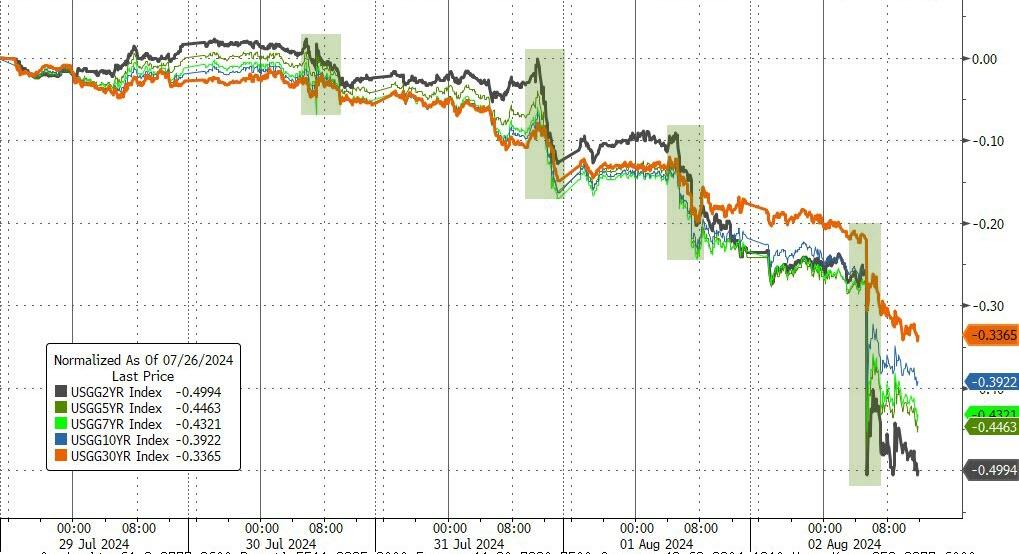
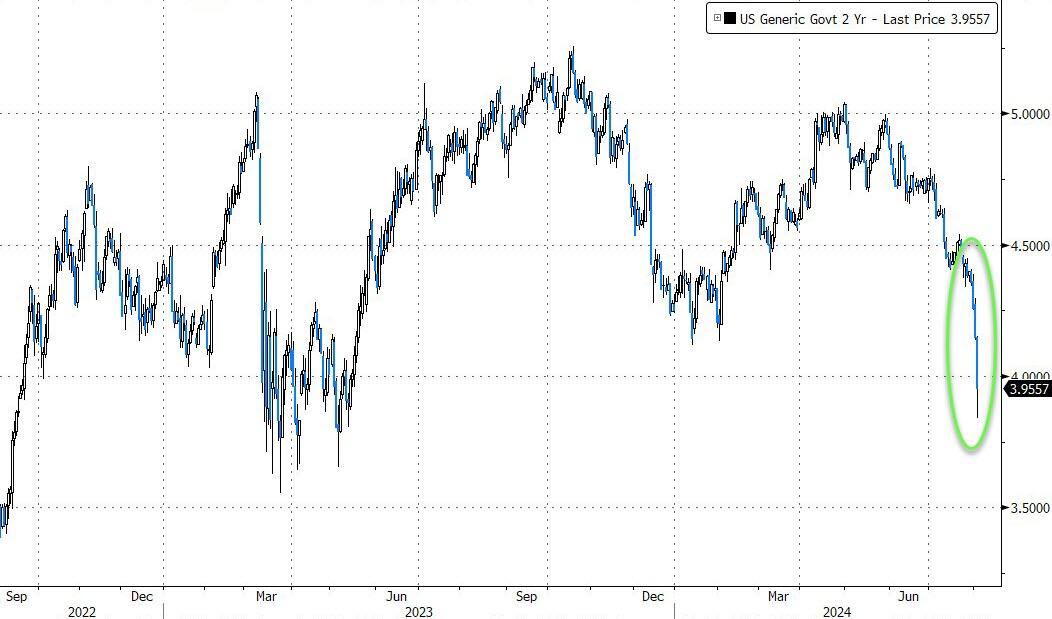
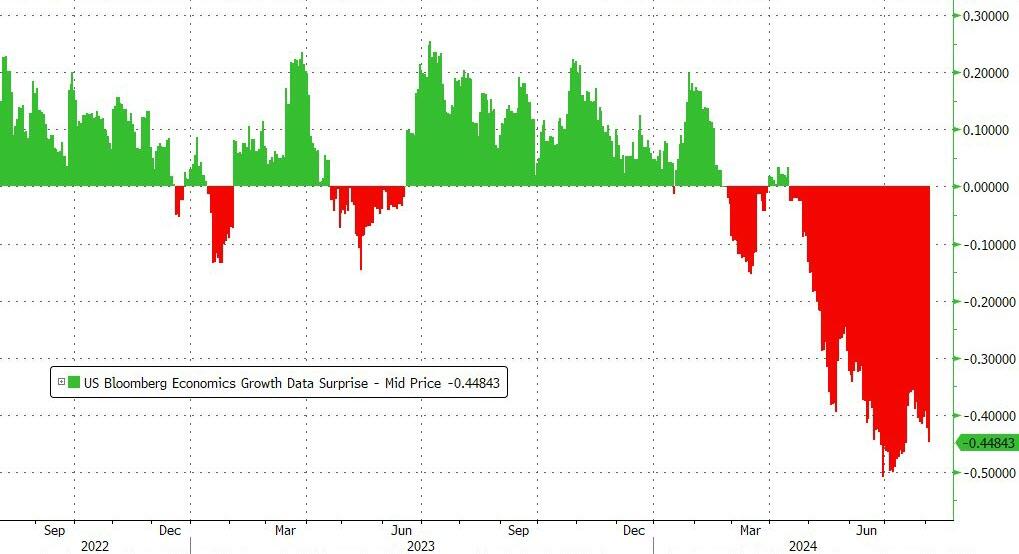
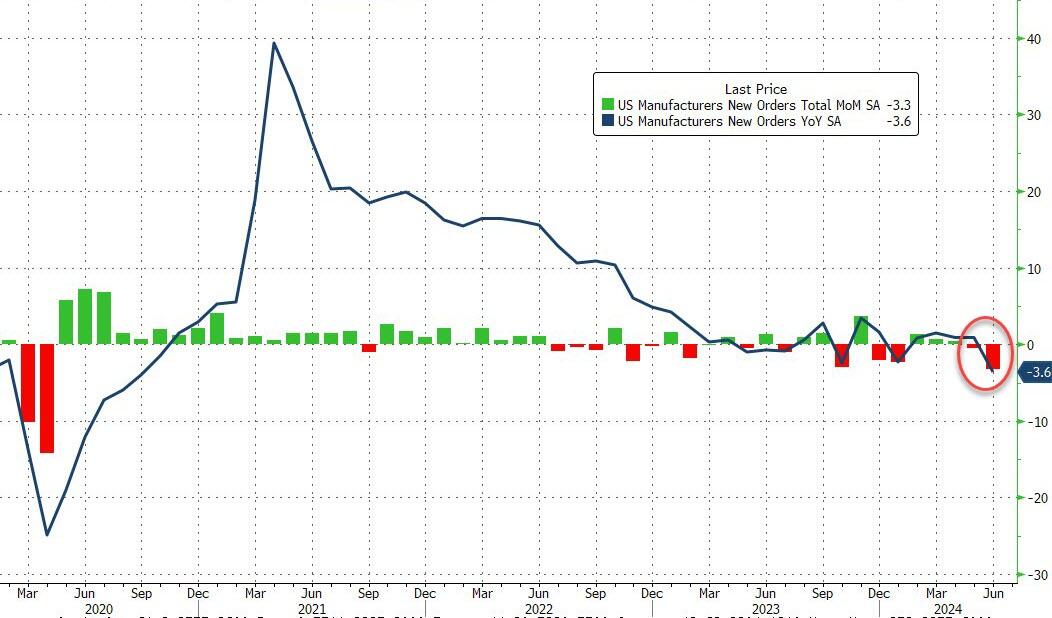
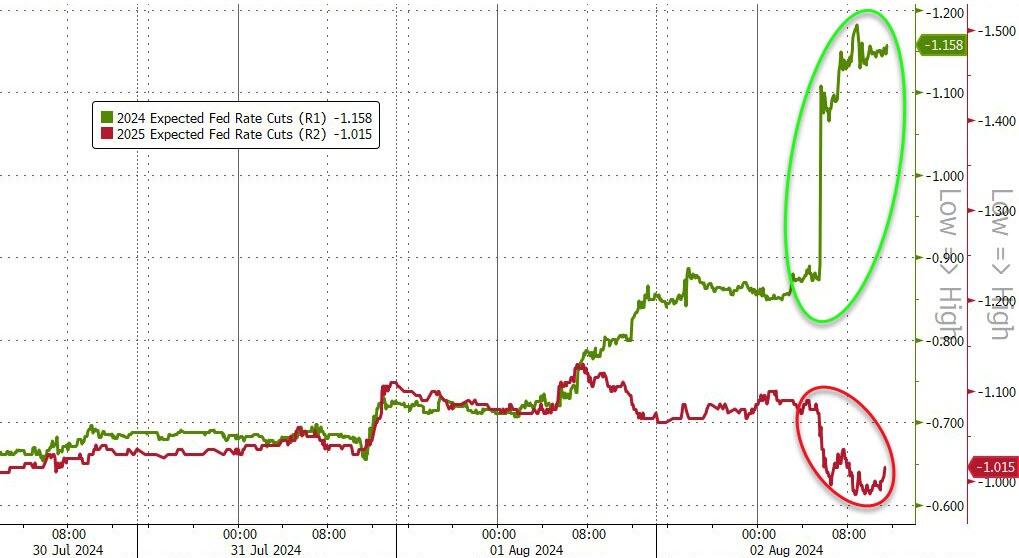
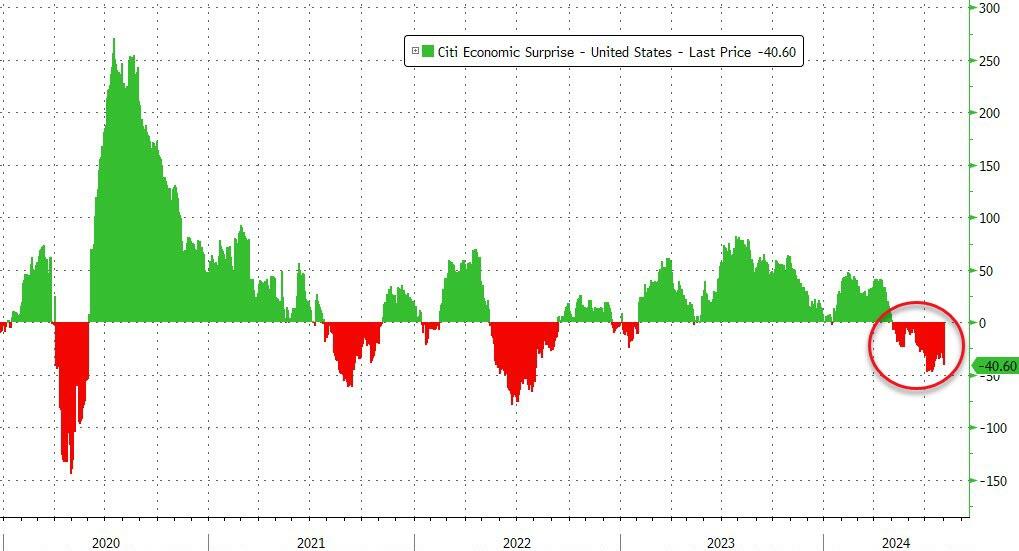
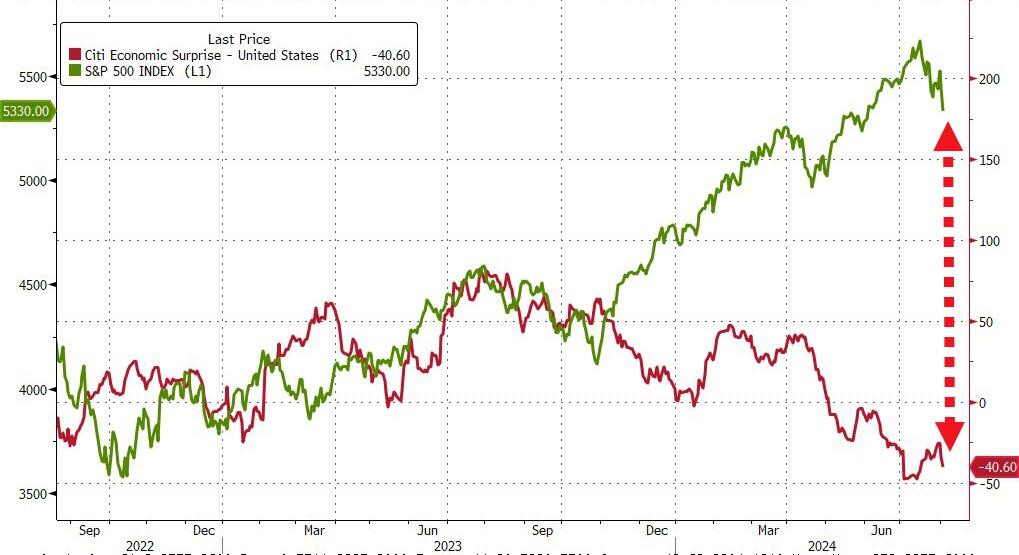
Bond yields fell sharply, with the 2-year yield dropping below 4% as investors sought safety. The market narrative shifted back to “bad is bad and good is good,” with growth concerns intensifying due to a 3.3% month-over-month decline in factory orders. Consequently, rate-cut expectations surged, with traders now anticipating four cuts for the remainder of 2024. The Citi Economic Index also declined, heightening growth fears among traders.
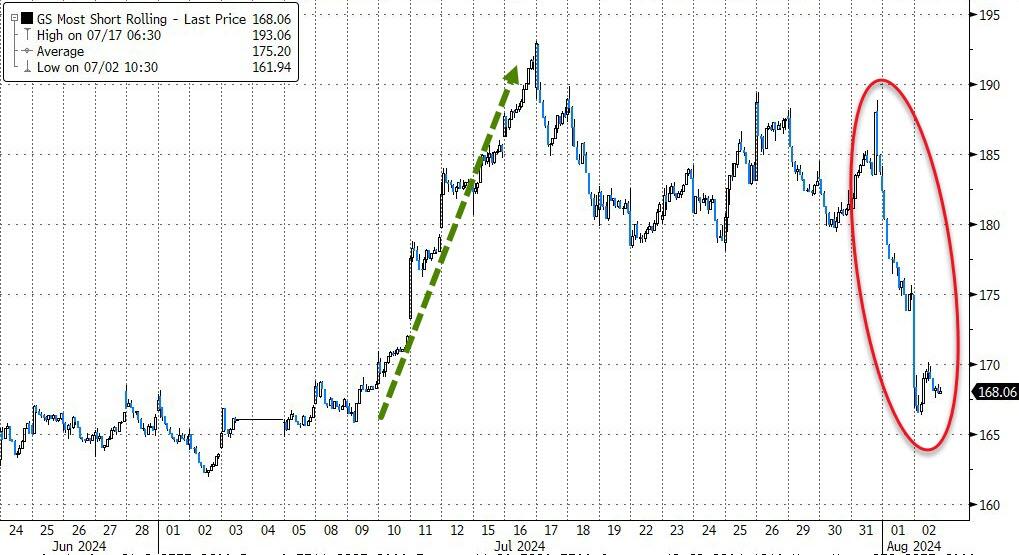
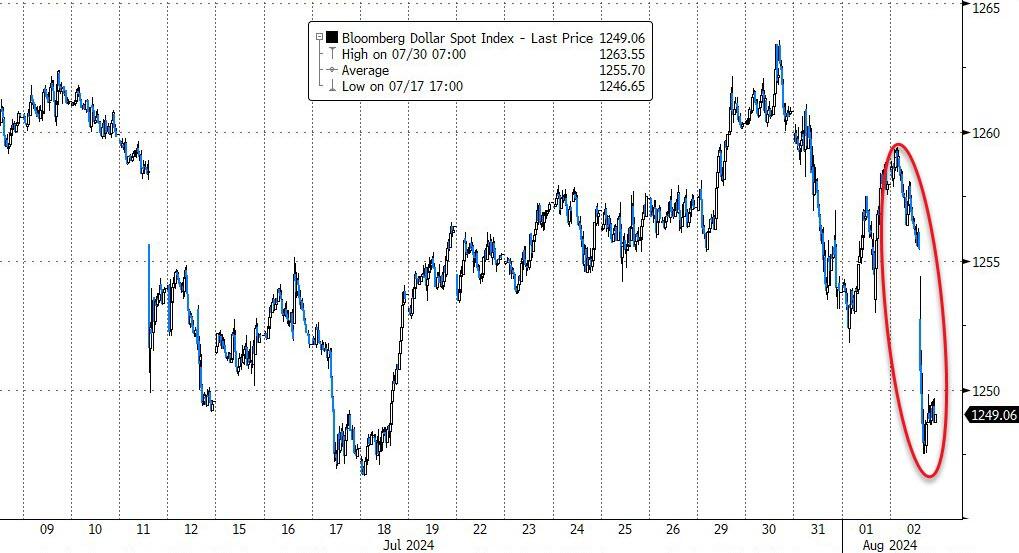
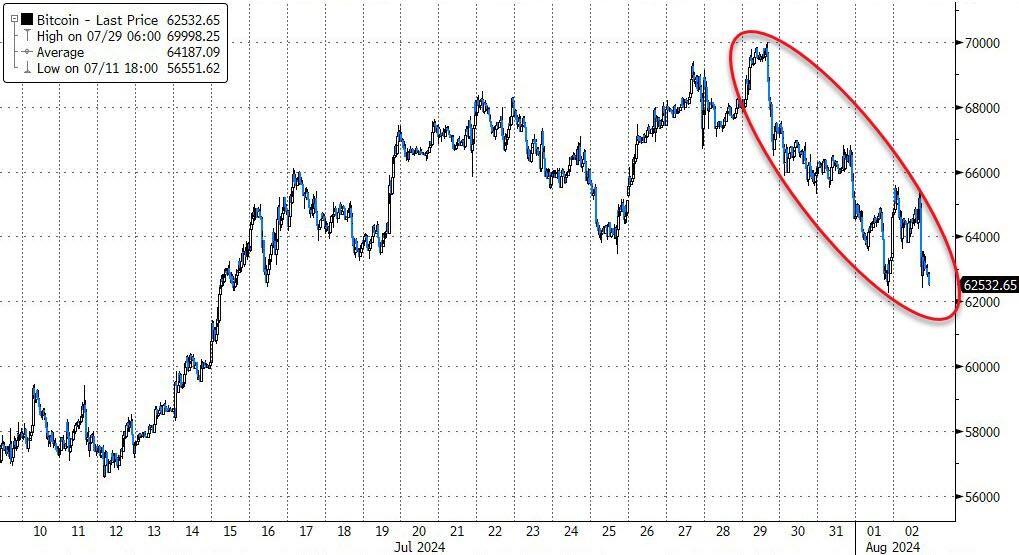
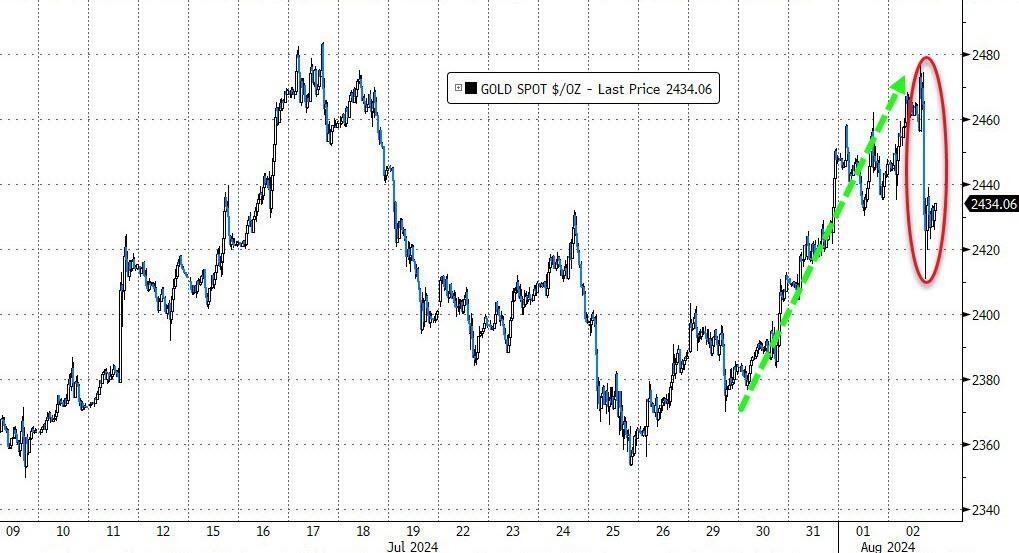
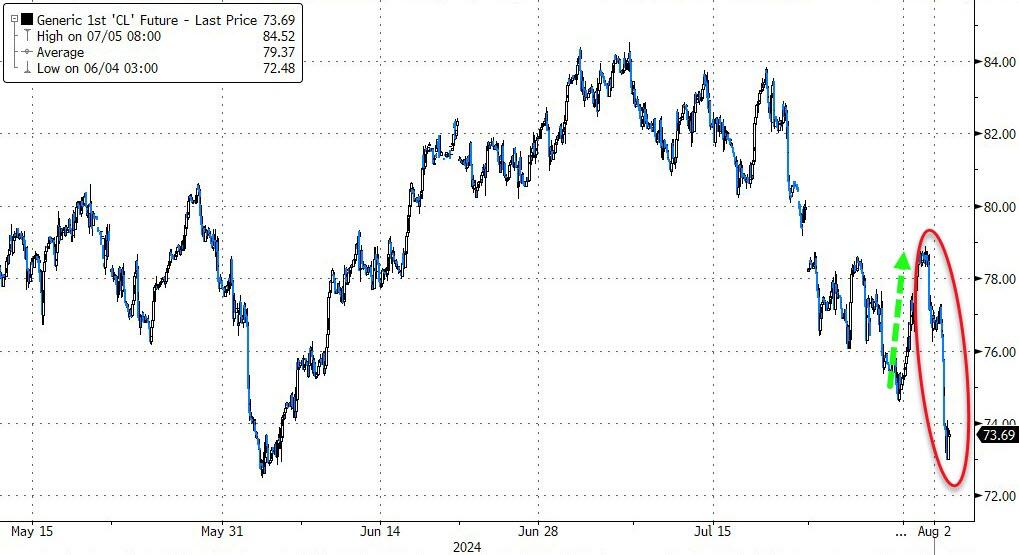
Throughout the week, heavily shorted stocks faced significant pressure, the dollar approached July’s lows, Bitcoin struggled but found support at the $62,000 level, and gold managed a weekly gain despite today’s decline. Crude oil prices fell to two-month lows amid rising tensions in the Middle East.
Reflecting on the broader picture, I am left with two key questions:
1. Is this week the beginning of a downward trend in stock prices, aligning with economic realities?
2. Is the Federal Reserve too late in adjusting its monetary policy?
2. Current “Buy” Cycles (effective 11/21/2023)
Our Trend Tracking Indexes (TTIs) have both crossed their trend lines with enough strength to trigger new “Buy” signals. That means, Tuesday, 11/21/2023, was the official date for these signals.
If you want to follow our strategy, you should first decide how much you want to invest based on your risk tolerance (percentage of allocation). Then, you should check my Thursday StatSheet and Saturday’s “ETFs on the Cutline” report for suitable ETFs to buy.
3. Trend Tracking Indexes (TTIs)
The market faced a challenging day, as a disappointing jobs report provided ample reasons for bearish sentiment to prevail. Equities across the board experienced significant declines, although they managed to recover slightly from their lowest points by the end of the session.
Unfortunately, our TTIs were not immune to the downturn and surrendered some of their recent gains.
This is how we closed 08/02/2024:
Domestic TTI: +4.28% above its M/A (prior close +6.56%)—Buy signal effective 11/21/2023.
International TTI: +2.86% above its M/A (prior close +5.36%)—Buy signal effective 11/21/2023.
All linked charts above are courtesy of Bloomberg via ZeroHedge.
———————————————————-
WOULD YOU LIKE TO HAVE YOUR INVESTMENTS PROFESSIONALLY MANAGED?
Do you have the time to follow our investment plans yourself? If you are a busy professional who would like to have his portfolio managed using our methodology, please contact me directly to get more details.
Contact Ulli