
ETF Tracker StatSheet
You can view the latest version here.
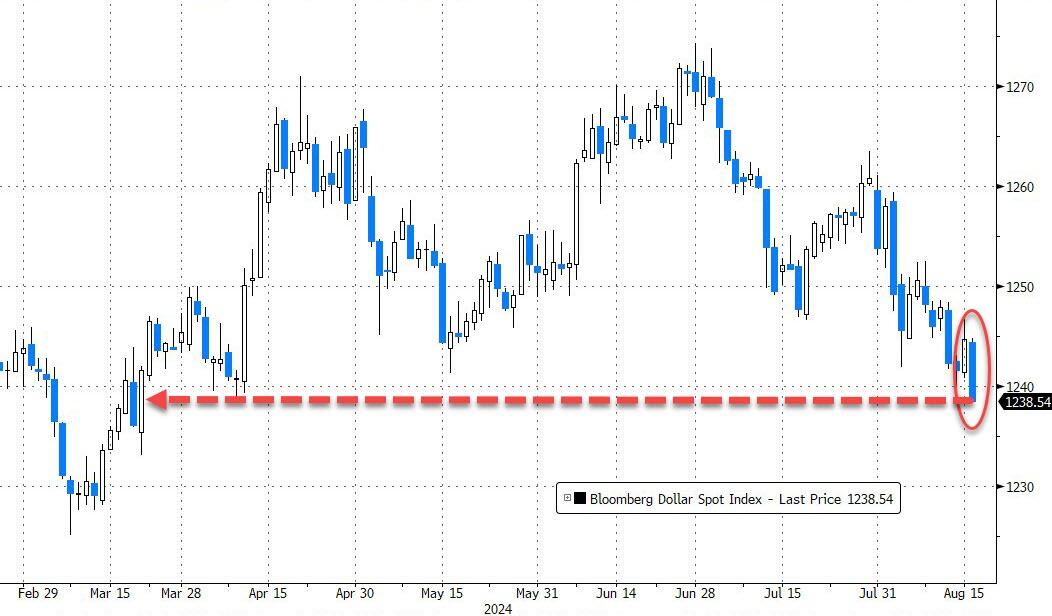
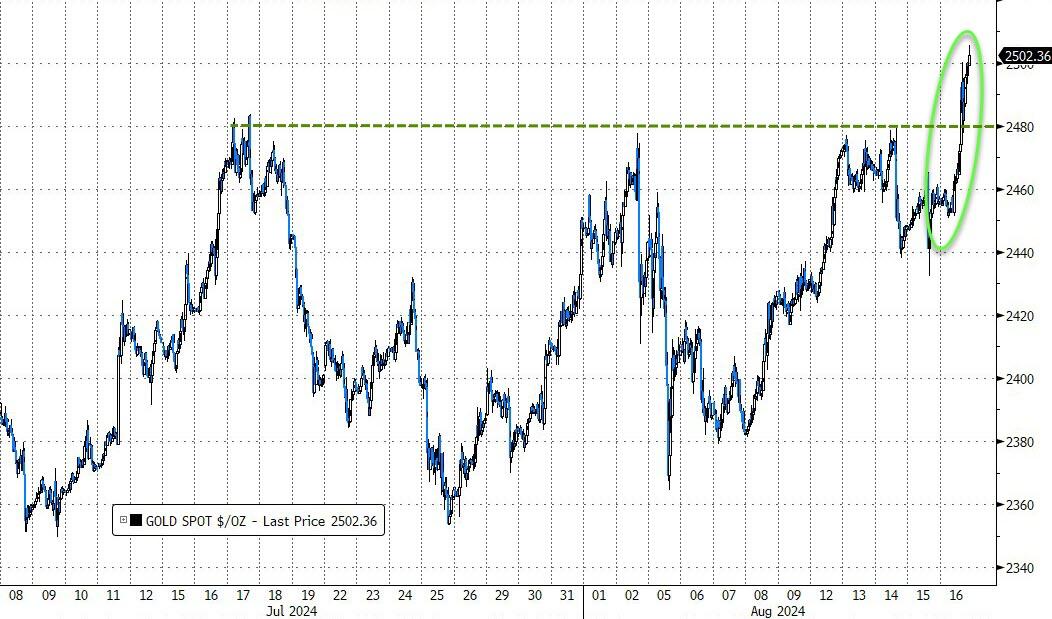
GOLD SURGES TO RECORD HIGH AS DOLLAR HITS 5-MONTH LOWS
- Moving the market
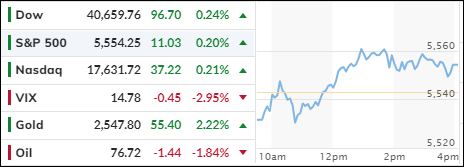
The major indexes entered a consolidation phase following this week’s recovery rally, which erased the losses sustained in early August. The S&P 500 has now broken even. A midday comeback propelled US equities to their best week since 2023, with the index recording a 3% gain for the week, marking its best performance since November 2023.
Despite Thursday’s retail sales exceeding expectations, the next monthly adjustment is likely to be downward, like the last 8 out of 10 adjustments. However, Wall Street remains focused on market-pleasing headline numbers, and this one is no exception. Coupled with a decline in initial jobless claims, traders are confident that recent recession fears were exaggerated, and a soft landing is still anticipated. Hope remains strong.
A looming recession and uncontrolled inflation will continue to be concerns for the foreseeable future, as I mentioned in previous commentaries. Nonetheless, a rate cut is expected when the Fed meets in September, not because inflation has been conquered, but due to dire economic conditions.
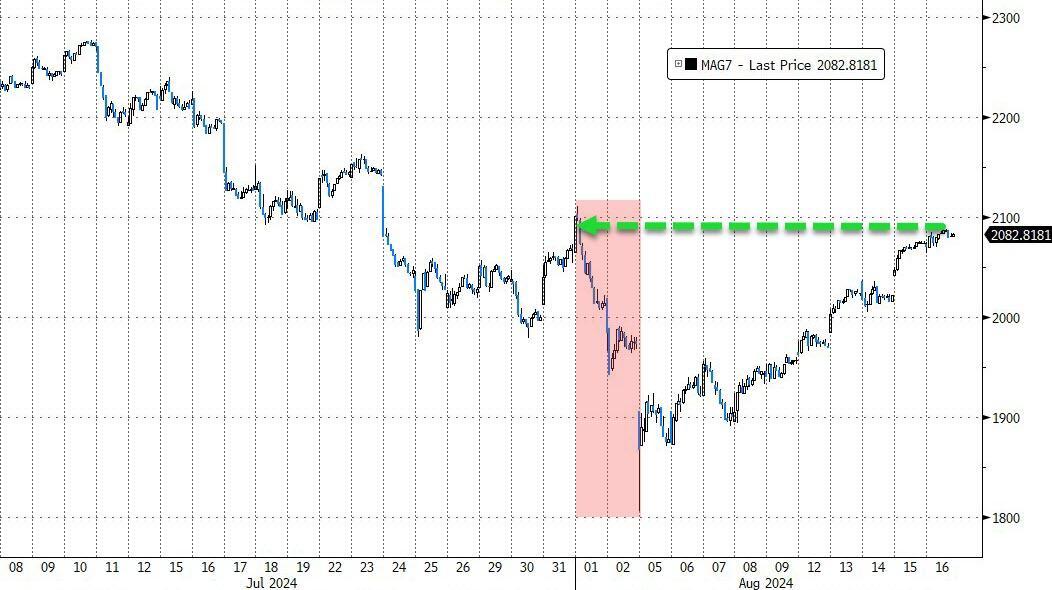
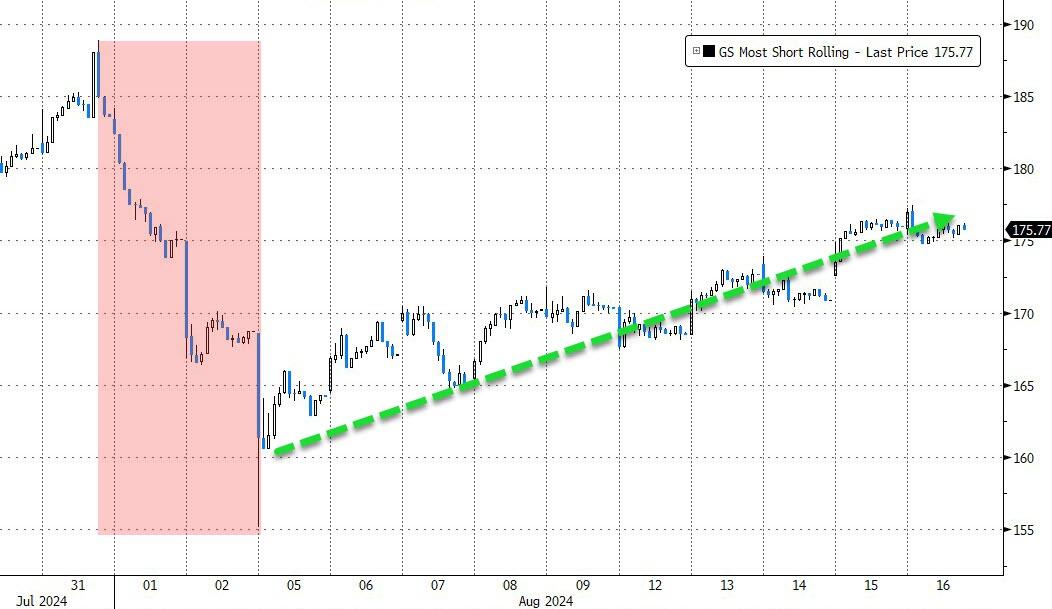
The dollar fell to 5-month lows, benefiting gold, which not only surpassed the $2,500 level for the first time but also surged 2.2% to a record high. The MAG 7 basket recovered from the early August downturn, recouping all losses, with the ongoing short squeeze contributing to bullish sentiment.
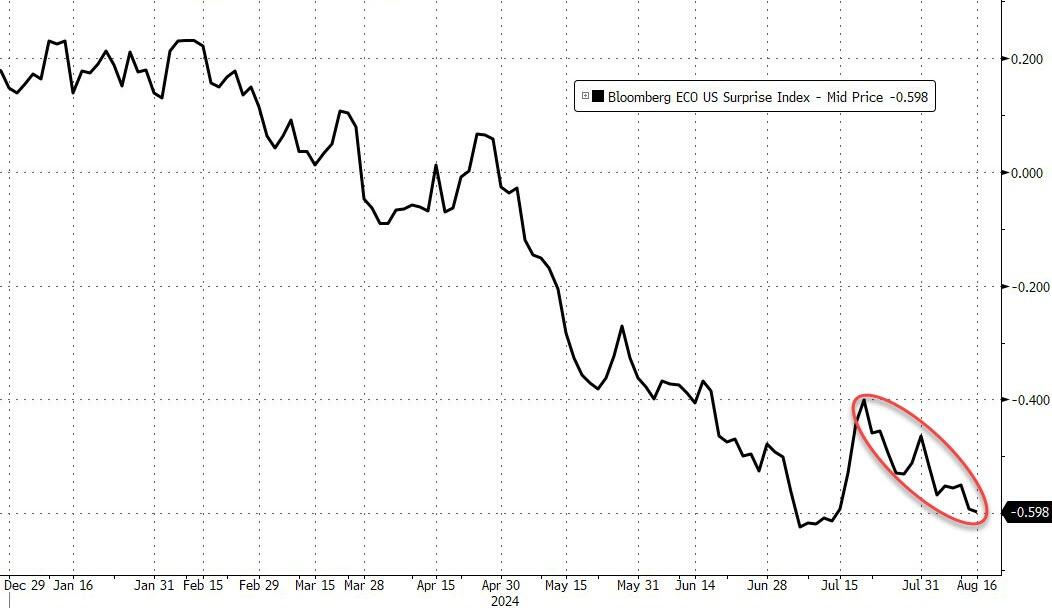
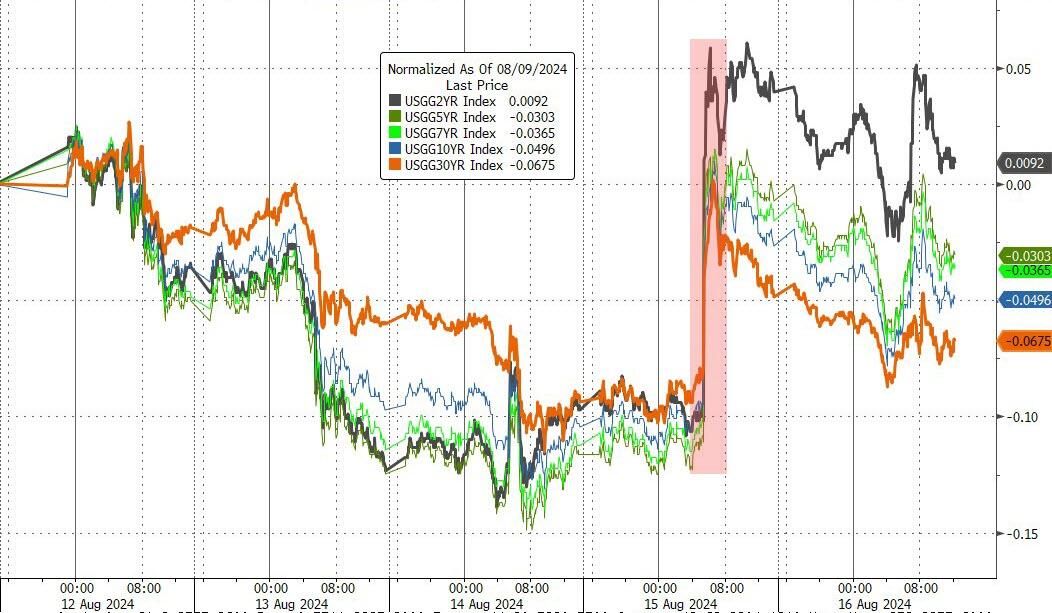
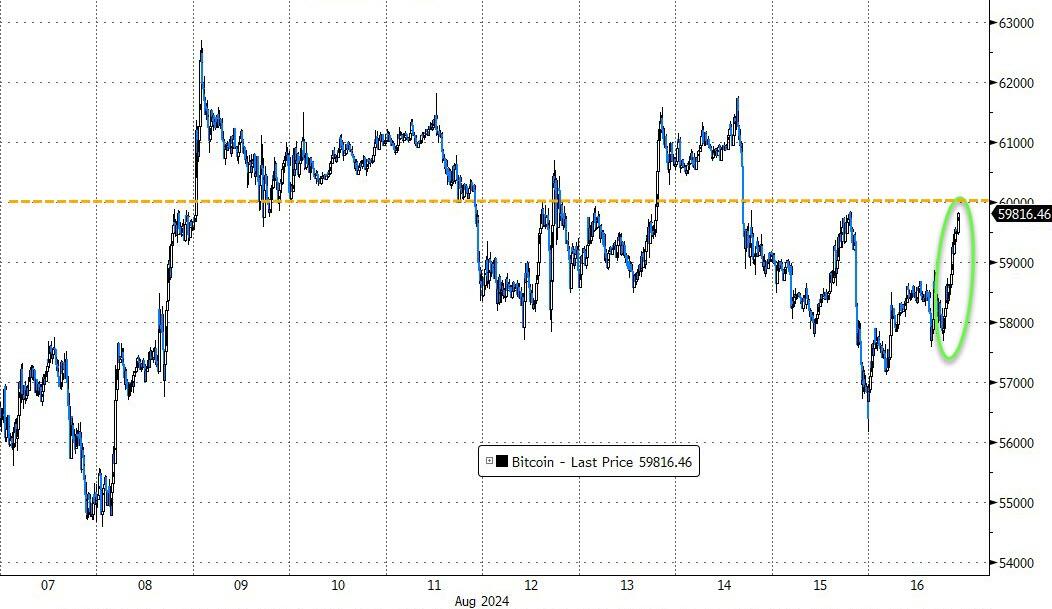
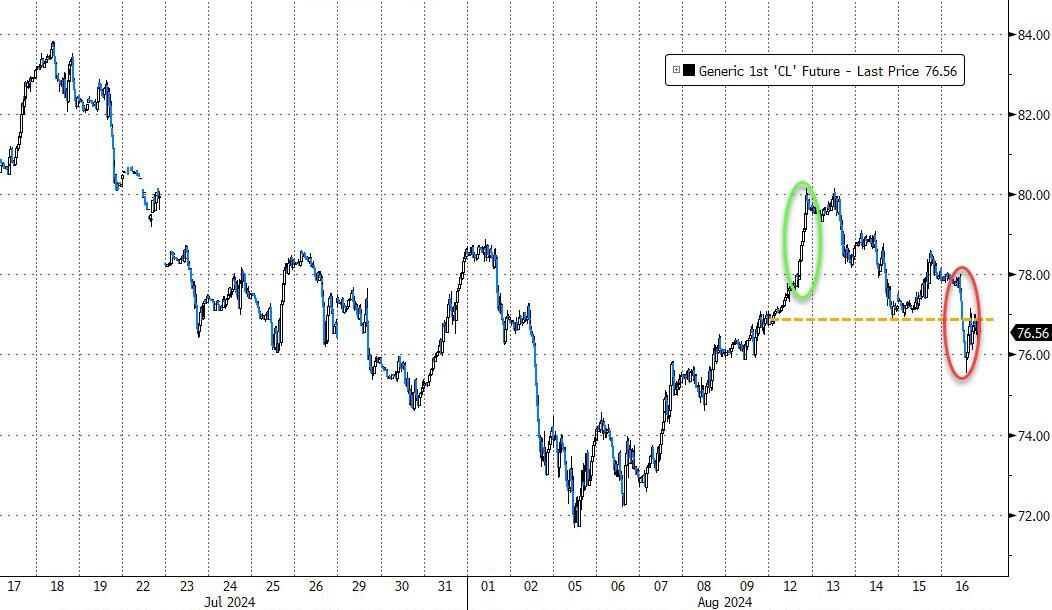
Despite the attention on the CPI, PPI, and retail sales, the Economic Surprise Index slid towards its all-time low, casting doubt on the market’s positive reaction as rate-cut expectations soured. For the week, bond yields remained even, Bitcoin fluctuated but ended unchanged, and oil prices were flat.
The bulls dominated this week, but it’s important to remember the causes of last week’s debacle: a sharp deterioration in US employment and the collapse of the Japanese yen carry trade.
These issues remain unresolved and have only been temporarily overshadowed by the latest headlines.
2. Current “Buy” Cycles (effective 11/21/2023)
Our Trend Tracking Indexes (TTIs) have both crossed their trend lines with enough strength to trigger new “Buy” signals. That means, Tuesday, 11/21/2023, was the official date for these signals.
If you want to follow our strategy, you should first decide how much you want to invest based on your risk tolerance (percentage of allocation). Then, you should check my Thursday StatSheet and Saturday’s “ETFs on the Cutline” report for suitable ETFs to buy.
3. Trend Tracking Indexes (TTIs)
After a sluggish beginning, the major indexes gradually gained momentum, ultimately achieving a moderately higher close. This marked the end of a successful comeback week.
Our TTIs showed mixed results, with the domestic TTI experiencing a slight decline, while the international TTI saw an increase.
This is how we closed 08/16/2024:
Domestic TTI: +5.86% above its M/A (prior close +6.09%)—Buy signal effective 11/21/2023.
International TTI: +5.77% below its M/A (prior close +5.14%)—Buy signal effective 11/21/2023.
All linked charts above are courtesy of Bloomberg via ZeroHedge.
———————————————————-
WOULD YOU LIKE TO HAVE YOUR INVESTMENTS PROFESSIONALLY MANAGED?
Do you have the time to follow our investment plans yourself? If you are a busy professional who would like to have his portfolio managed using our methodology, please contact me directly to get more details.
Contact Ulli