
- Moving the market
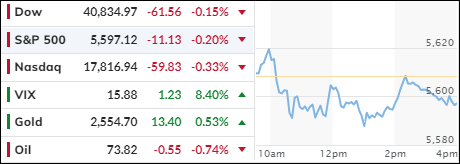
Equities slipped early on, as bullish sentiment faltered slightly after the consistent recovery over the past week, with the S&P 500 registering eight straight winning sessions. Reduced volatility was the main contributor after the disastrous start to August.
Earnings reports were mixed, with Palo Alto Networks jumping while home retailer Lowe’s dropped after poor revenue and a negative outlook based on expectations of slowing consumer spending.
The latter contrasts with recent reports of strong retail sales data, which will likely be adjusted again, and softer CPI/PPI reports. A weak jobs report and an interest rate hike in Japan have been pushed to the back burner and out of traders’ minds.
This week, the focus is on the Jackson Hole symposium, where the Fed is expected to be clearer about a potential rate cut in September. Traders are convinced that such a cut will happen, so their current discussion focuses mainly on whether it will be 0.25% or 0.5%.
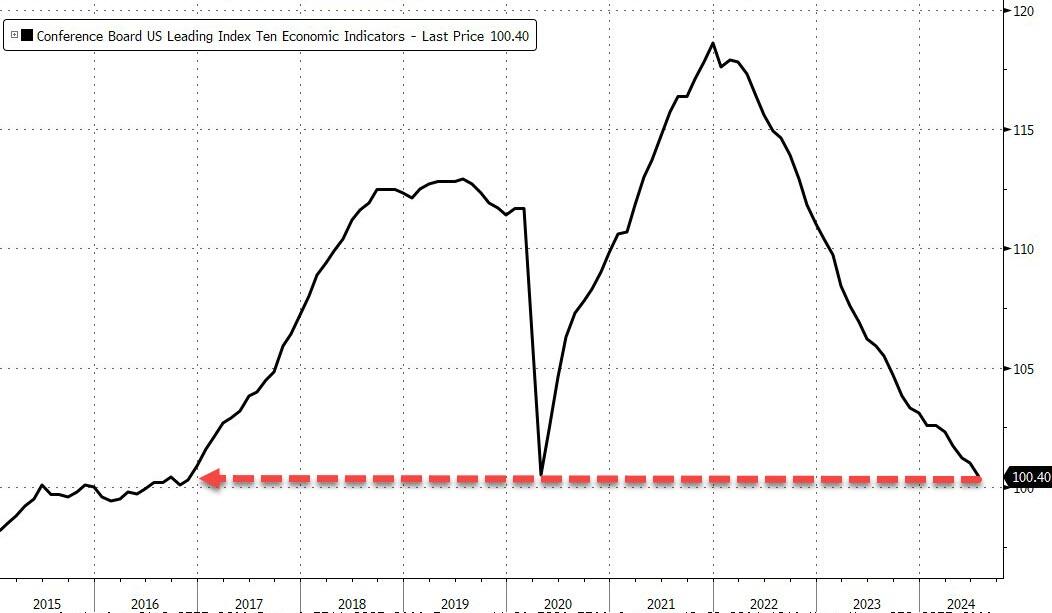
After all, the economy is rolling over, as I pointed out yesterday with the Leading Economic Indicators being down for the 29th month.
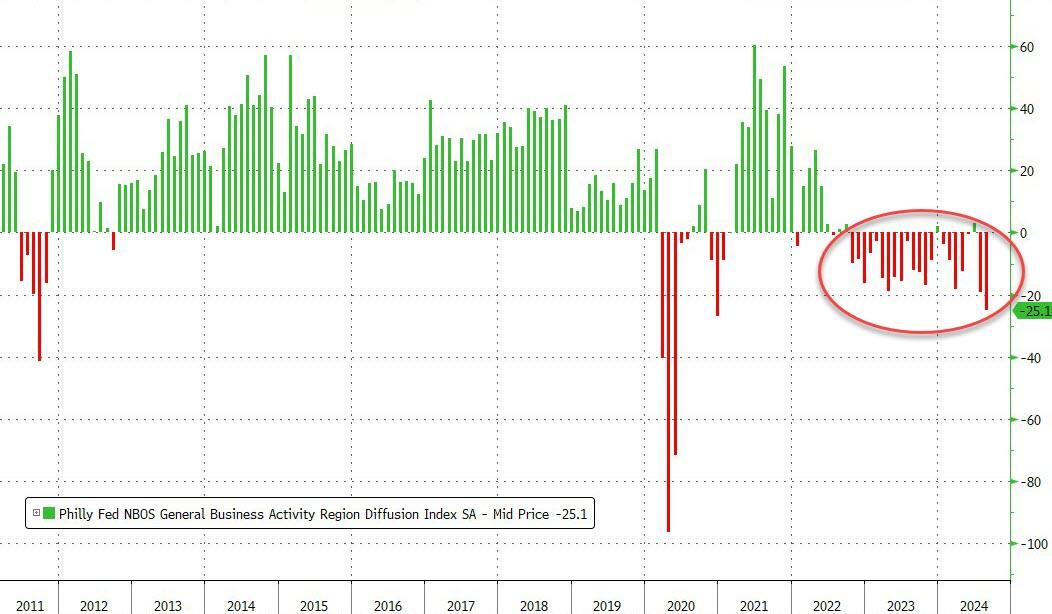
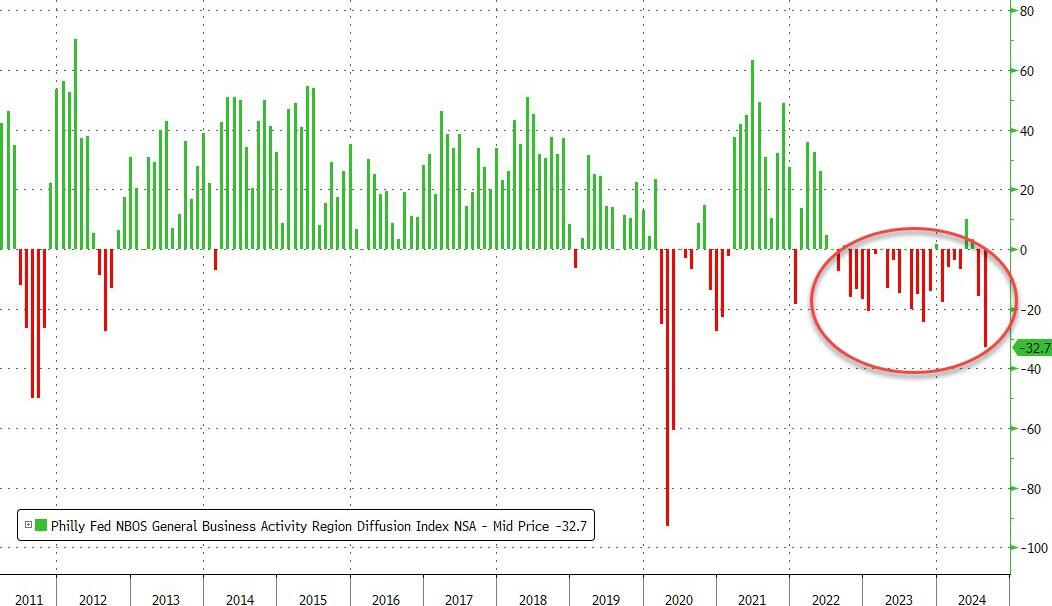
Today, we learned that the Philly Fed General Business Activity Index crashed to -25.1 in August, its weakest level since the Covid lockdowns. As ZH mentioned, on a non-seasonally adjusted basis, it was an even bigger collapse. Ouch!
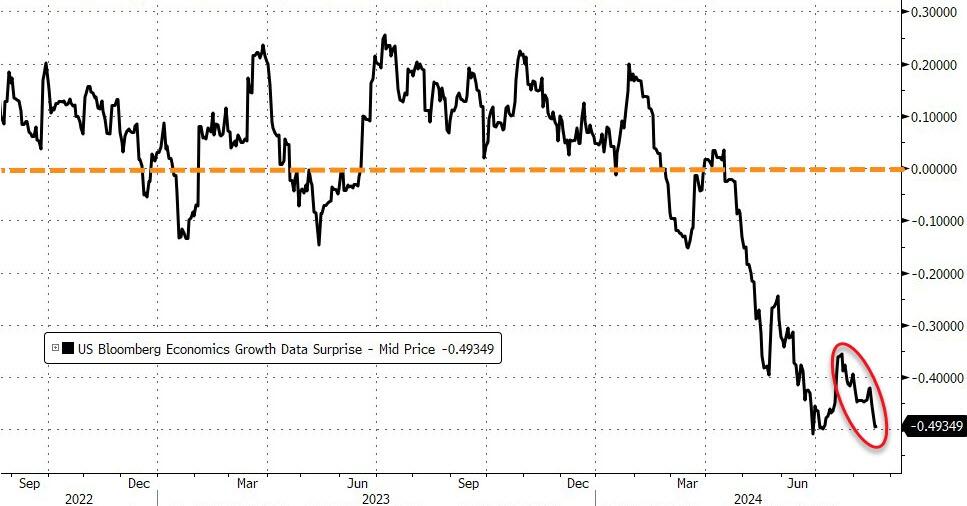
At the same time, the Economic Growth data index dropped back to multiyear lows, also confirming that the Fed may no longer have the luxury to refer to this weakness as “transitory.”
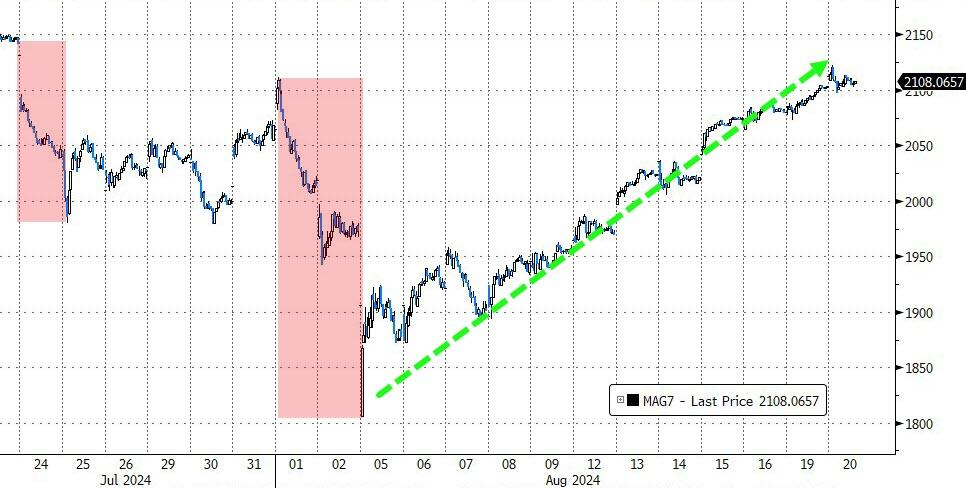
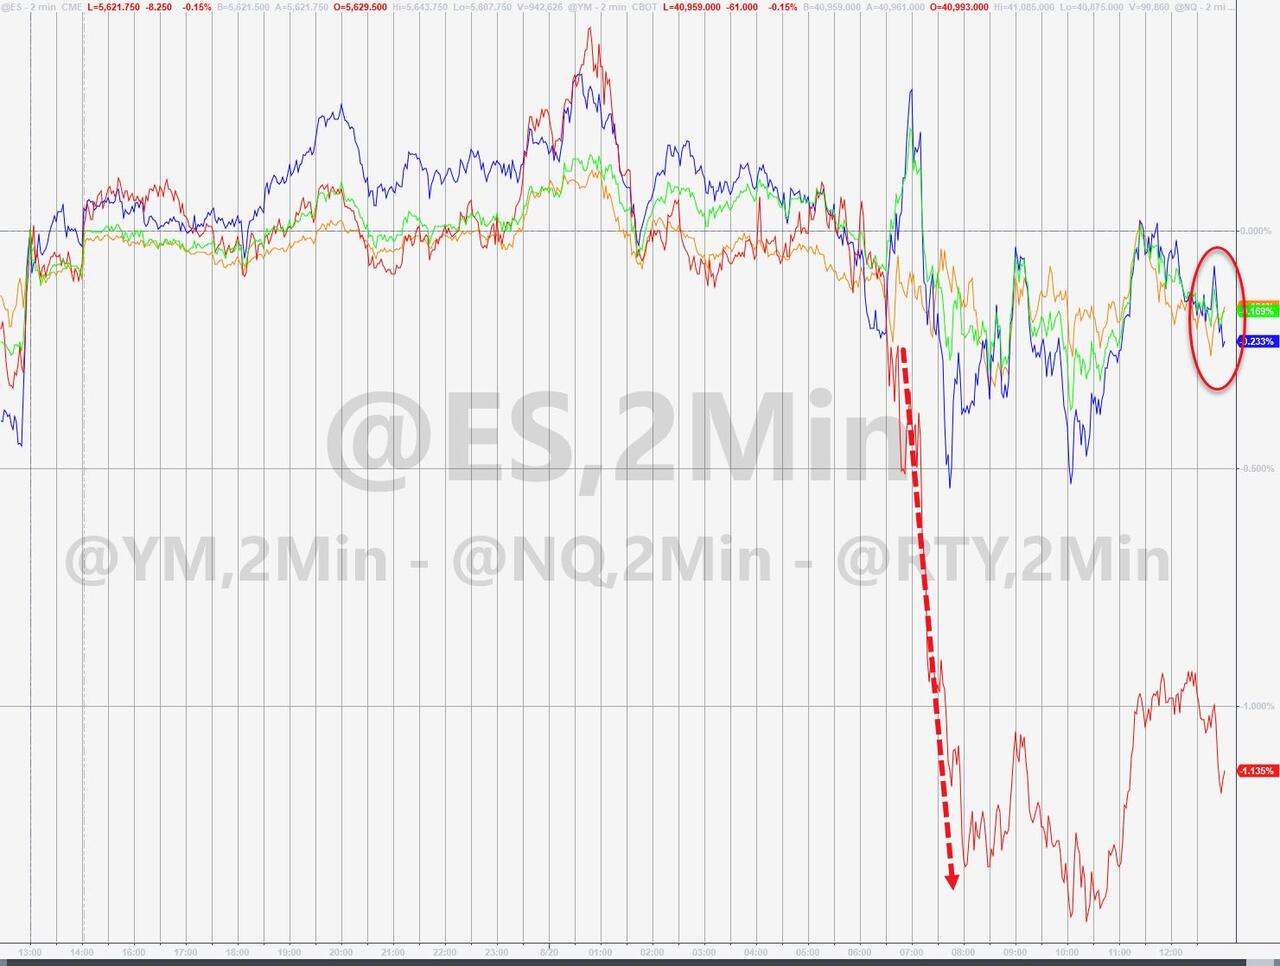
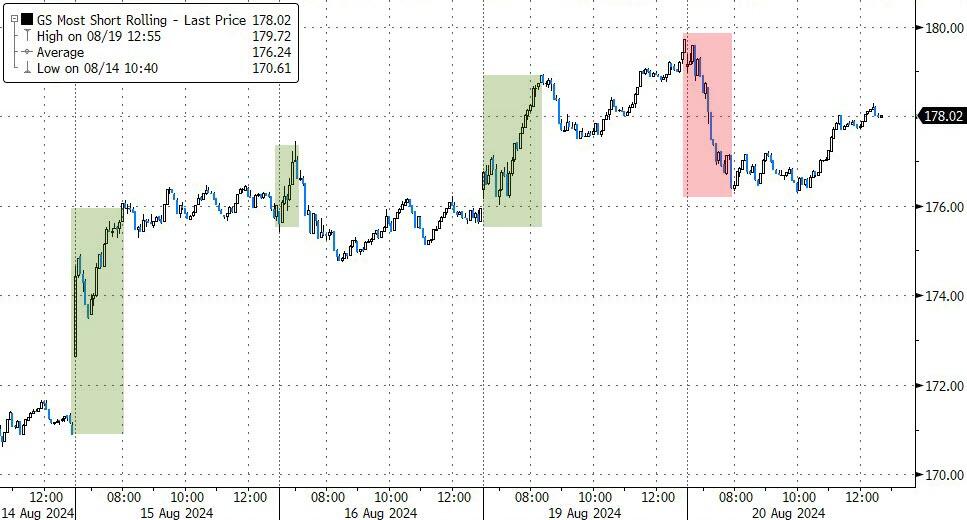
The MAG 7 stocks managed to eke out another winning session, but Small Caps were hammered today, likely due to the most shorted stocks not giving an assist.
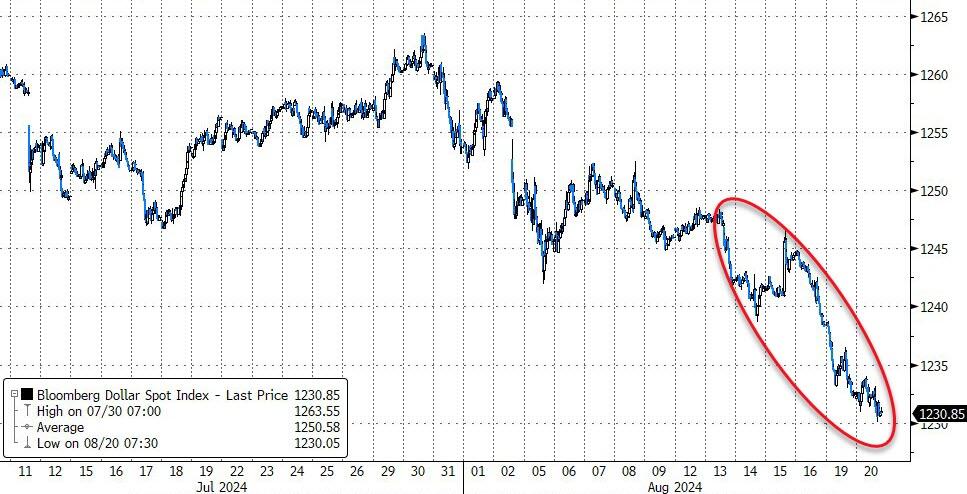
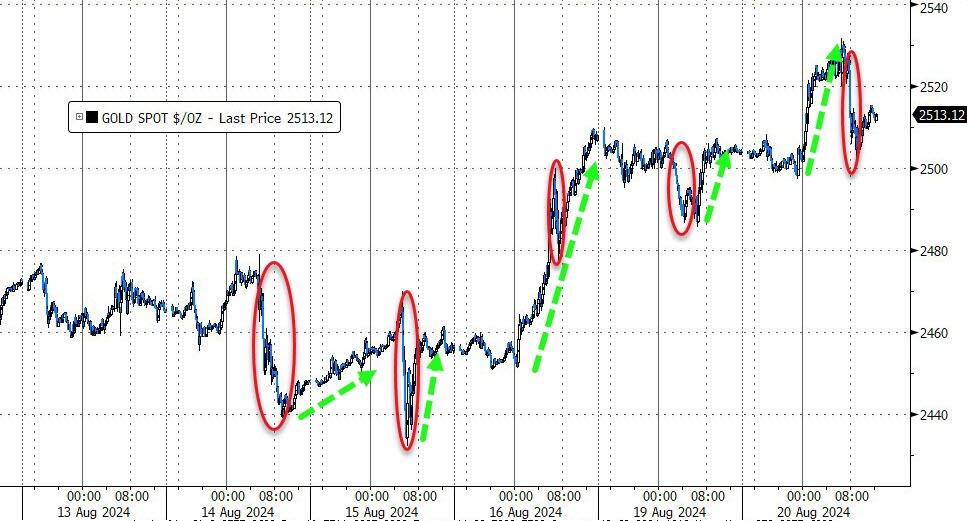
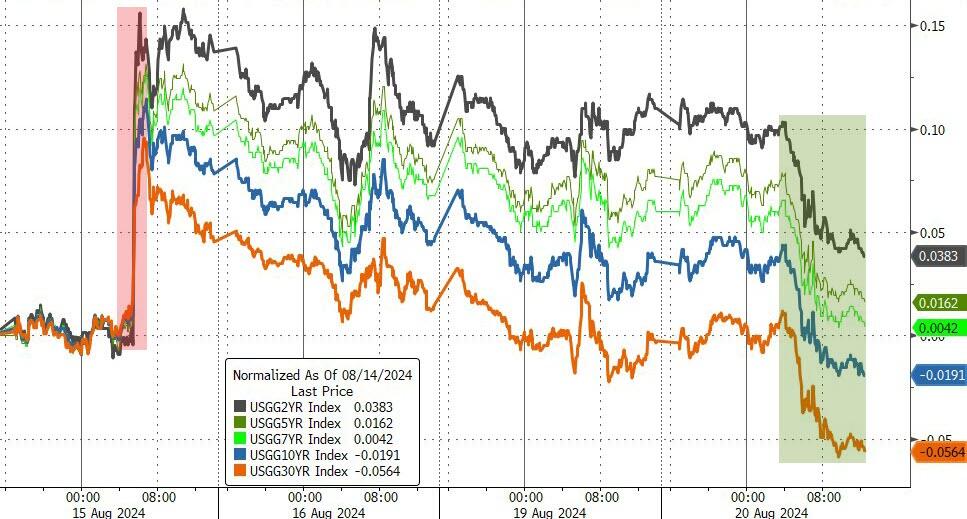
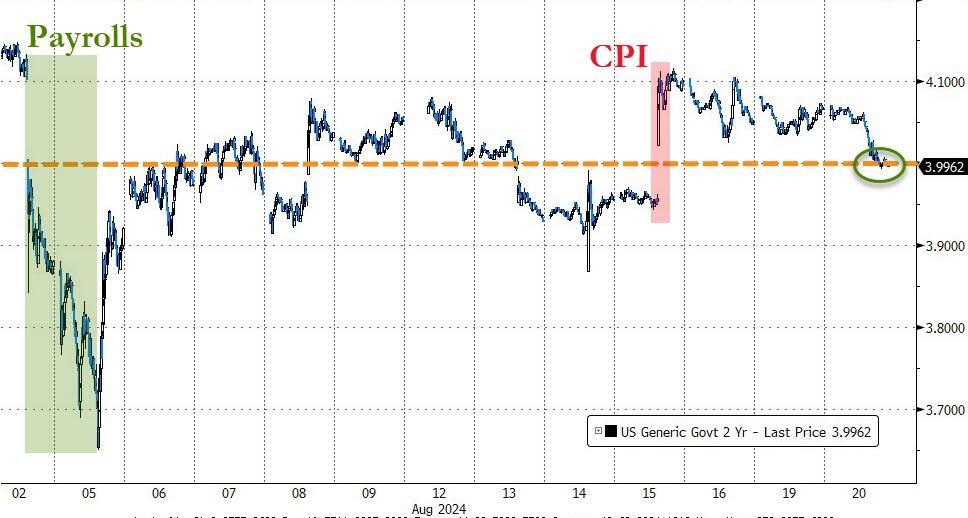
The dollar continued its southerly route, thereby helping gold surge to another record high, a move also supported by plunging bond yields, as the 2-year dropped back below its 4% level.
Crude oil headed lower and took out its $74 level, while Bitcoin surged overnight in Asia and Europe but was pulled back down during the US session.
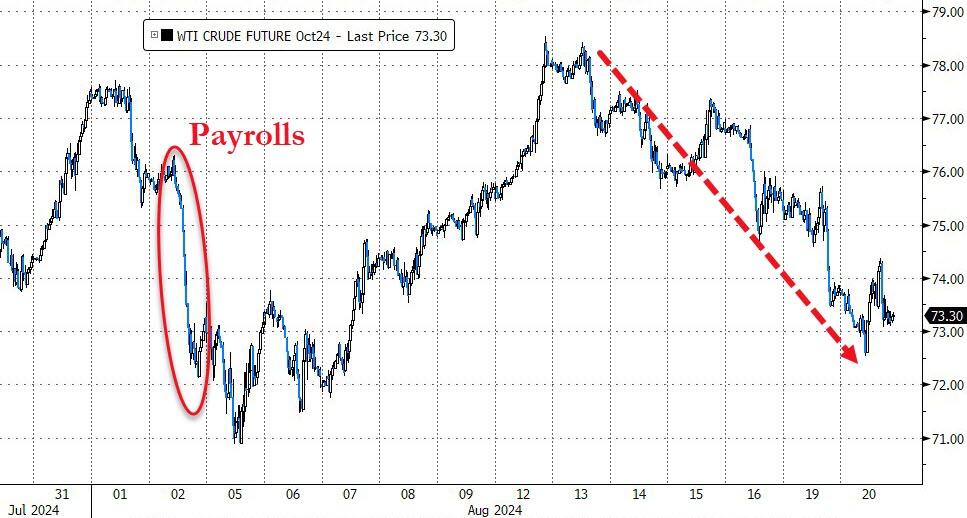
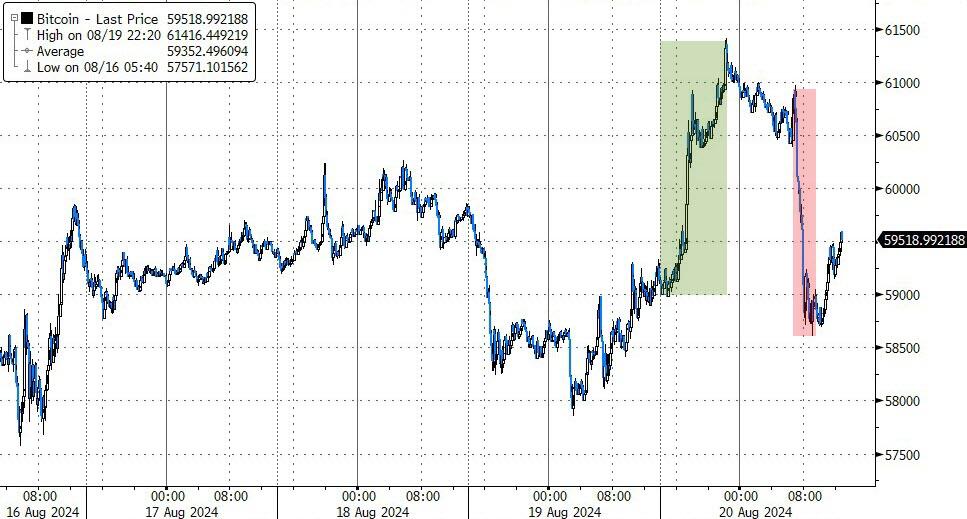
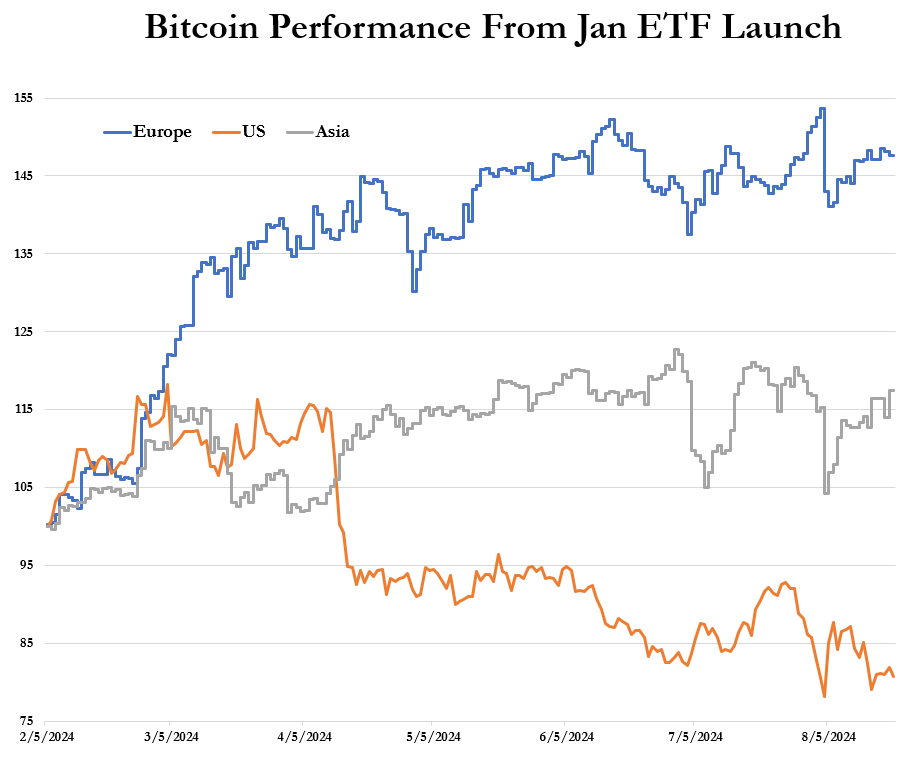
This makes me ponder how such discrepancies could exist. Could it possibly be market manipulation?
2. Current “Buy” Cycles (effective 11/21/2023)
Our Trend Tracking Indexes (TTIs) have both crossed their trend lines with enough strength to trigger new “Buy” signals. That means, Tuesday, 11/21/2023, was the official date for these signals.
If you want to follow our strategy, you should first decide how much you want to invest based on your risk tolerance (percentage of allocation). Then, you should check my Thursday StatSheet and Saturday’s “ETFs on the Cutline” report for suitable ETFs to buy.
3. Trend Tracking Indexes (TTIs)
The major indexes fluctuated, primarily hovering just below their respective unchanged lines. Despite this, the losses were relatively modest, especially considering the recent gains.
Similarly, our TTIs mirrored this trend, ultimately closing slightly lower.
This is how we closed 08/20/2024:
Domestic TTI: +6.24% above its M/A (prior close +6.66%)—Buy signal effective 11/21/2023.
International TTI: +6.64% below its M/A (prior close +6.73%)—Buy signal effective 11/21/2023.
All linked charts above are courtesy of Bloomberg via ZeroHedge.
———————————————————-
WOULD YOU LIKE TO HAVE YOUR INVESTMENTS PROFESSIONALLY MANAGED?
Do you have the time to follow our investment plans yourself? If you are a busy professional who would like to have his portfolio managed using our methodology, please contact me directly to get more details.
Contact Ulli