
- Moving the market
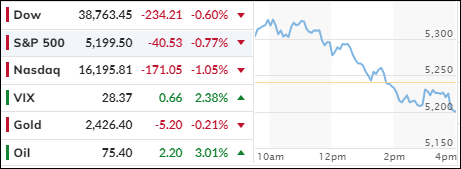
After yesterday’s comeback session, bullish sentiment persisted in the markets as traders attempted to recover some of the recent losses. However, the bears ultimately took control, causing major indexes to reverse and close in the red. The Dow experienced its worst five-day start to a month in six years.
The tech sector failed to maintain its early rally, with mega-cap stocks all posting losses exceeding 2%. Notably, Super Micro Computer plummeted by approximately 20% due to earnings misses, followed by Airbnb, which saw a 15% decline.
Although yesterday’s rebound provided some relief and lifted all 11 sectors of the S&P 500, its sustainability remains uncertain. We are navigating tumultuous times, with unresolved issues such as Black Monday’s selloff, banking, debt, and deficits looming in the background.
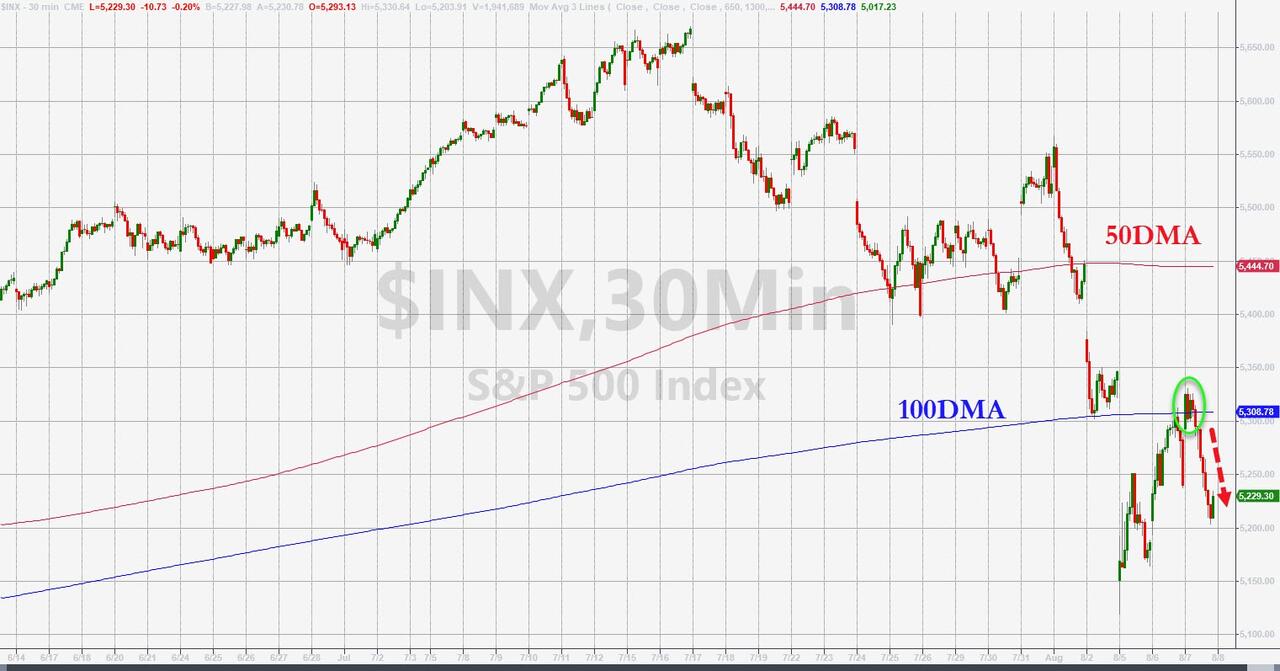
Key support levels were breached, with the S&P 500 testing its 100-day moving average but falling below it as bearish sentiment prevailed. The index remains 3.65% away from its 200-day moving average, and if this level is breached, it could signal the end of the bull market.
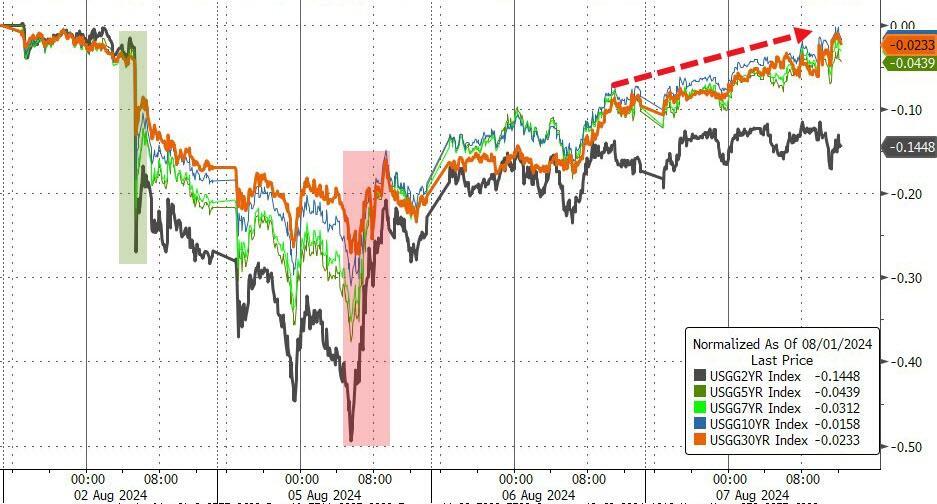
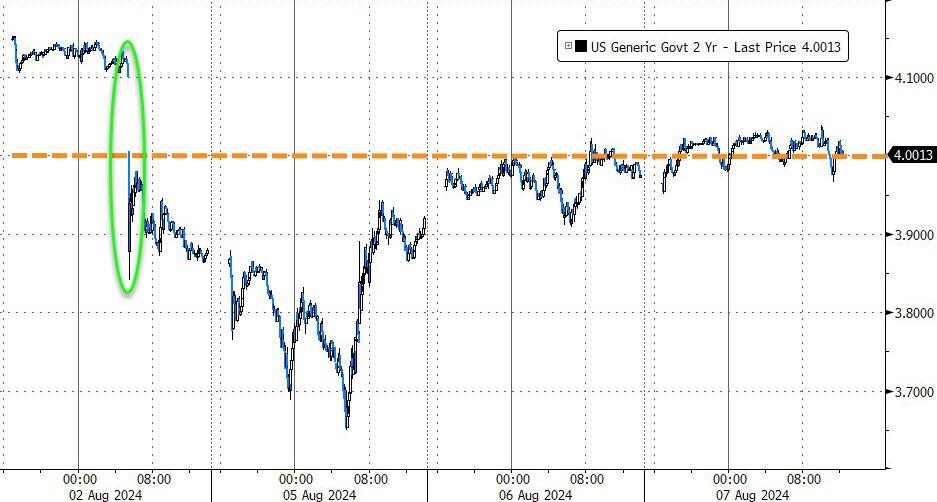
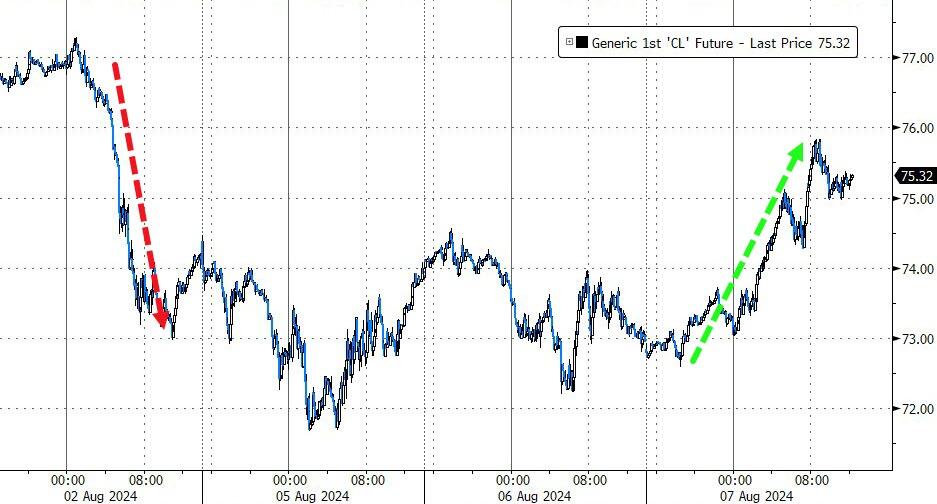
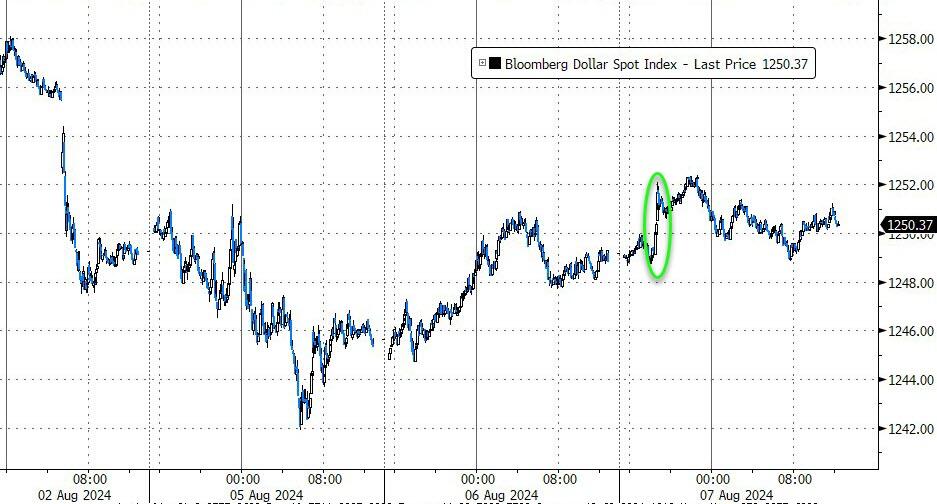
Bond yields rose following a disappointing 10-year auction, with the 10-year yield hovering around 4%. Rate-cut expectations for 2024 remained flat, crude oil prices rallied, and the dollar saw moderate gains.
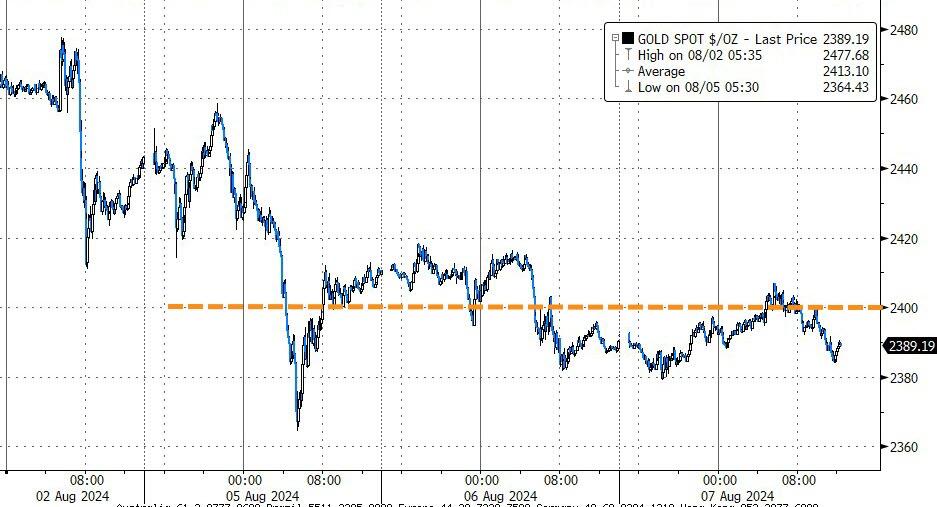
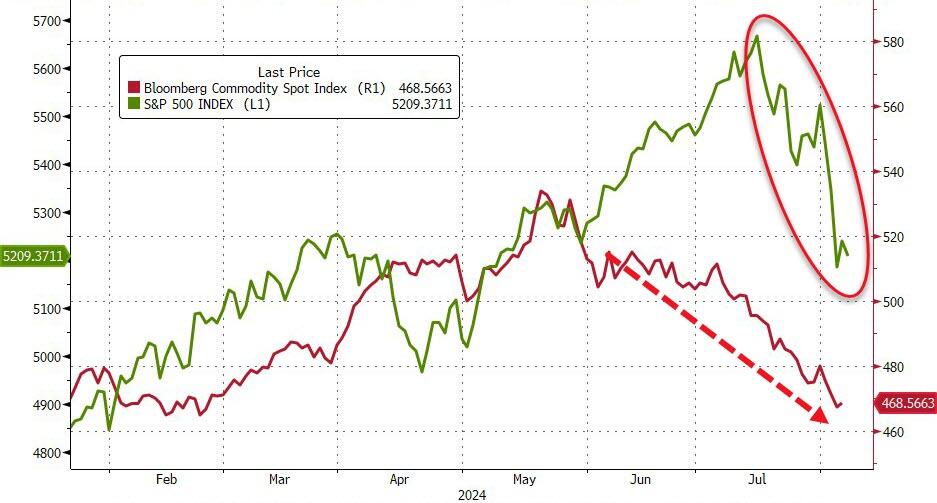
Gold dipped slightly, while Bitcoin surged towards the $58,000 level but failed to reach it and subsequently reversed. Commodity prices have been declining, which, according to this chart, has dragged down equities.
Is this a warning sign of what’s to come?
Continue reading…
2. Current “Buy” Cycles (effective 11/21/2023)
Our Trend Tracking Indexes (TTIs) have both crossed their trend lines with enough strength to trigger new “Buy” signals. That means, Tuesday, 11/21/2023, was the official date for these signals.
If you want to follow our strategy, you should first decide how much you want to invest based on your risk tolerance (percentage of allocation). Then, you should check my Thursday StatSheet and Saturday’s “ETFs on the Cutline” report for suitable ETFs to buy.
3. Trend Tracking Indexes (TTIs)
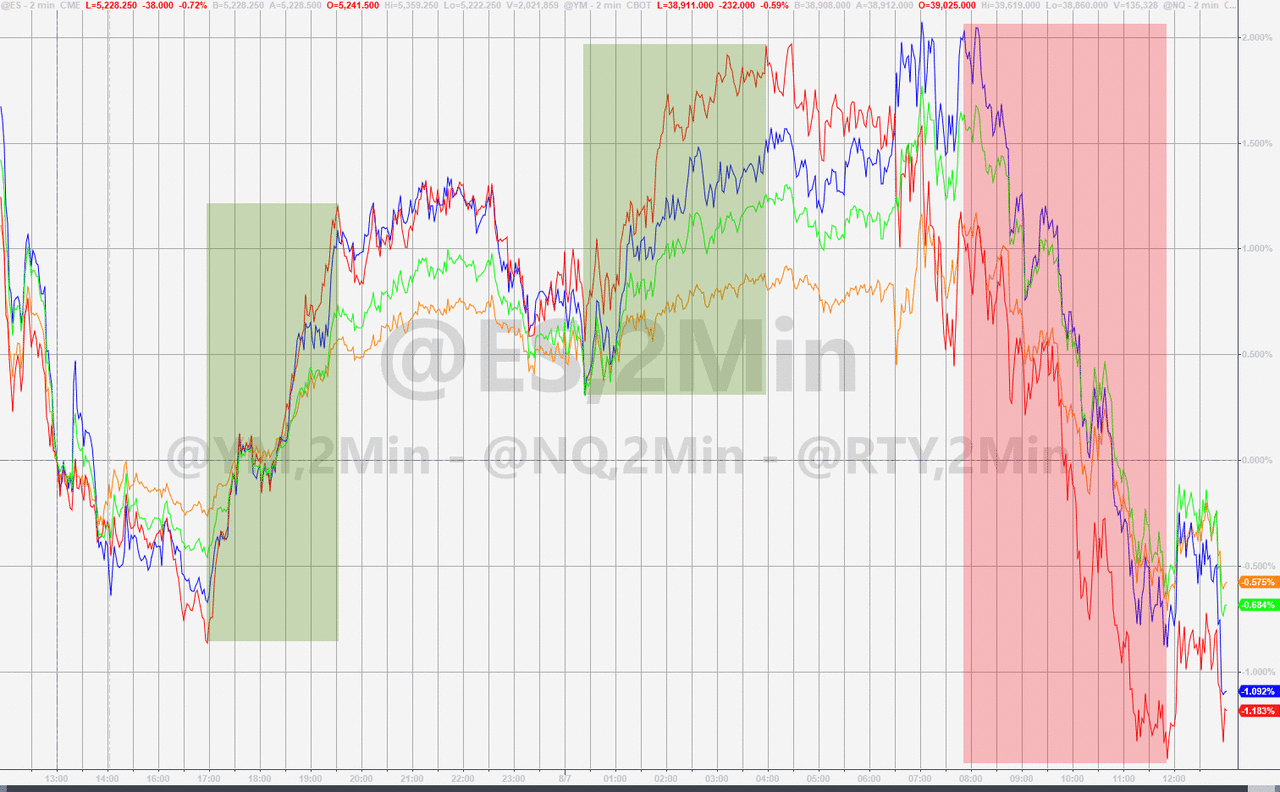
Wall Street underwent a dramatic shift in fortunes as an early rally abruptly reversed course, leading to a disappointing close with major indexes ending in the red.
Traders were caught off guard by this sudden downturn.
Our TTIs presented a mixed scenario: while the International TTI showed a slight gain, the Domestic TTI edged closer to a critical threshold that could soon trigger a “Sell” signal. If you are tracking these developments, it’s essential to stay tuned for the latest updates.
This is how we closed 08/07/2024:
Domestic TTI: +1.72% above its M/A (prior close +2.44%)—Buy signal effective 11/21/2023.
International TTI: +0.81% below its M/A (prior close +0.26%)—Buy signal effective 11/21/2023.
All linked charts above are courtesy of Bloomberg via ZeroHedge.
———————————————————-
WOULD YOU LIKE TO HAVE YOUR INVESTMENTS PROFESSIONALLY MANAGED?
Do you have the time to follow our investment plans yourself? If you are a busy professional who would like to have his portfolio managed using our methodology, please contact me directly to get more details.
Contact Ulli