
- Moving the market
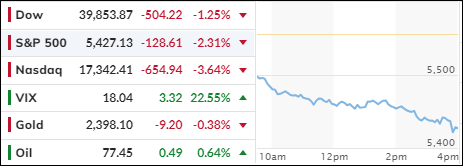
The word of the day was “underwhelming,” as disappointing earnings from Alphabet and Tesla dragged the Nasdaq down by approximately 3.5%, while the S&P 500 slipped by 2.3%. Alphabet’s shares fell by 5%, and Tesla’s stock proved even more volatile, plummeting 11% due to weaker-than-expected results. Major players like Nvidia, Meta, and Microsoft also suffered, with losses ranging from 4% to 6%.
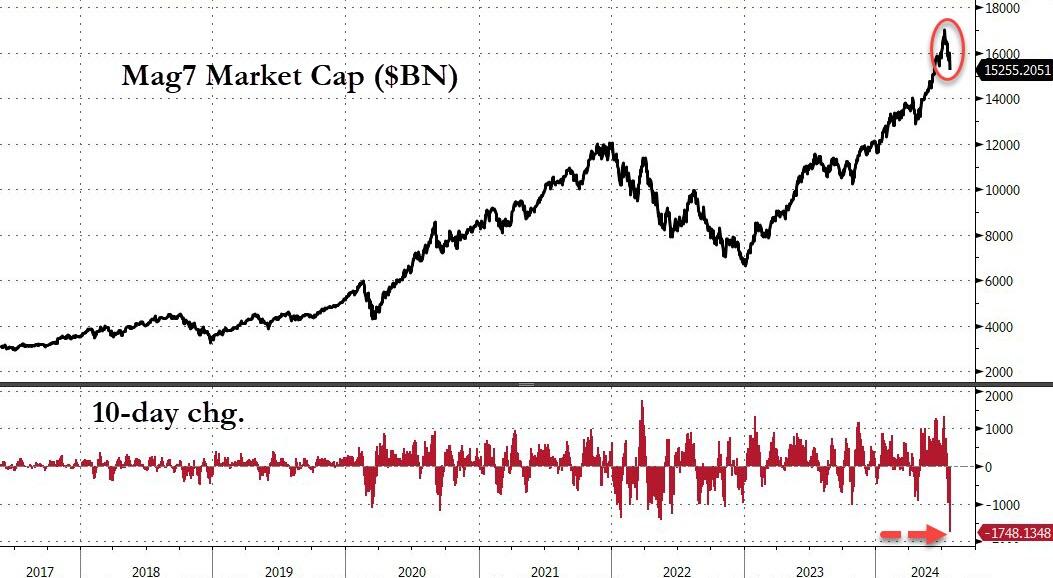
This marked the first significant reaction of mega-cap companies to a weakening economy. Traders are closely monitoring this development, as these companies were primarily responsible for the outsized returns in the first half of 2024.
The results from the MAG7 will likely indicate whether the tech sector has exhausted its momentum or if there is still potential for further gains to sustain bullish sentiment. However, today, this group of stocks experienced its largest daily loss since October 2022, with all seven components closing in the red.
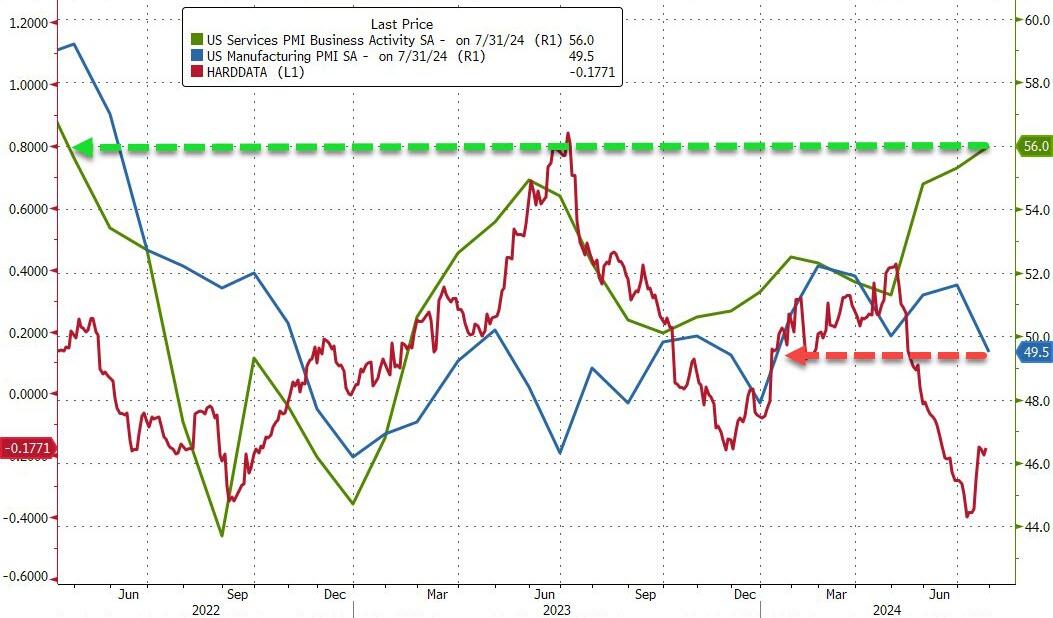
Adding to the market’s woes was a report showing weaker-than-expected manufacturing data, with the output index falling to 49.5 in July, indicating contraction. New orders, production, and inventories declined, making a mockery of the forecasted 51.5 index reading.
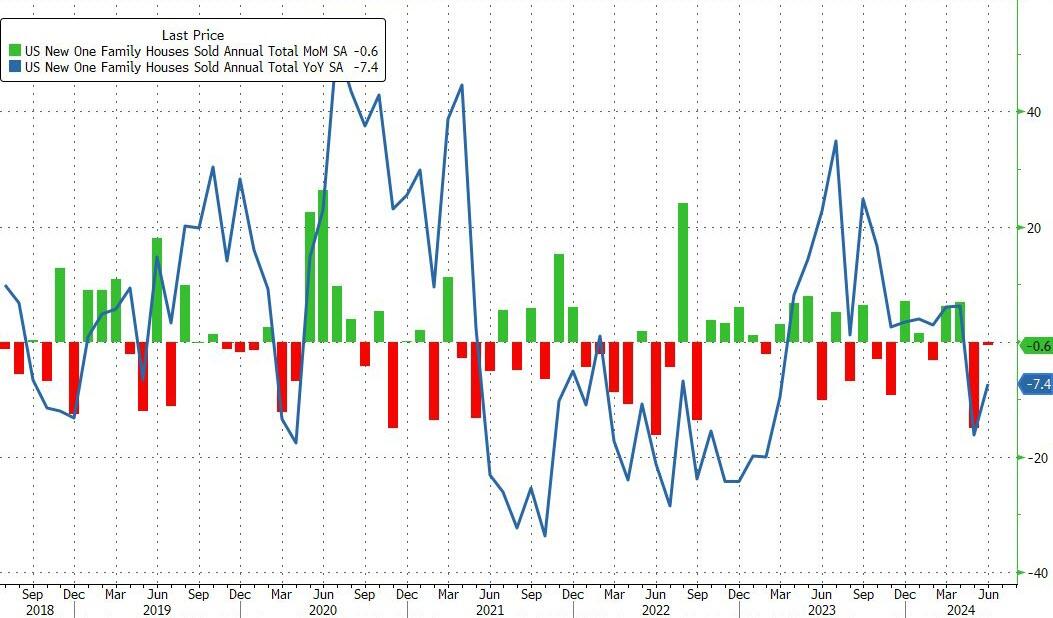
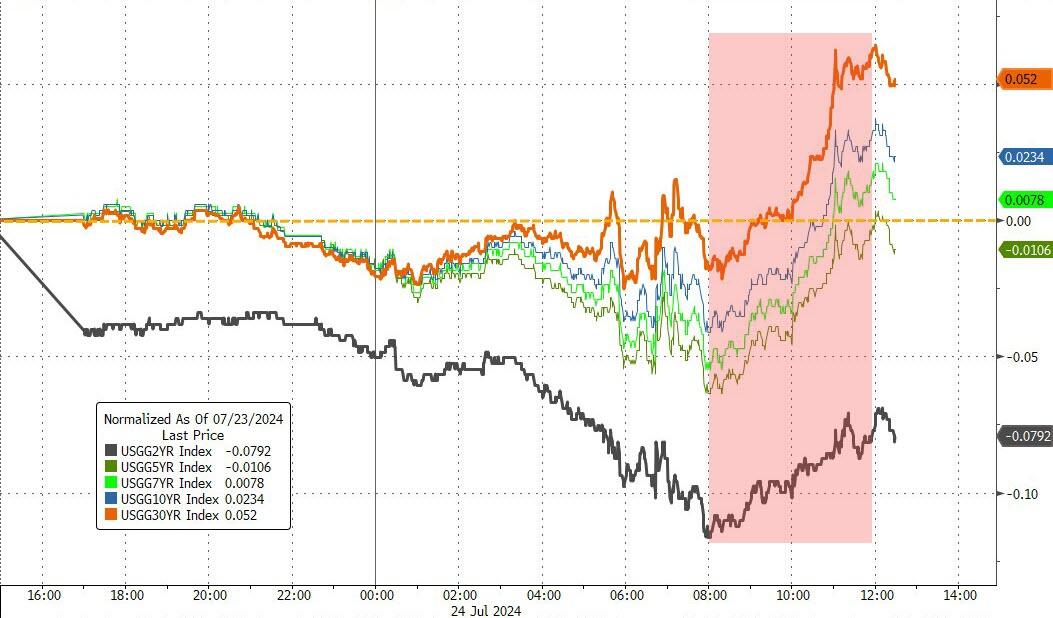
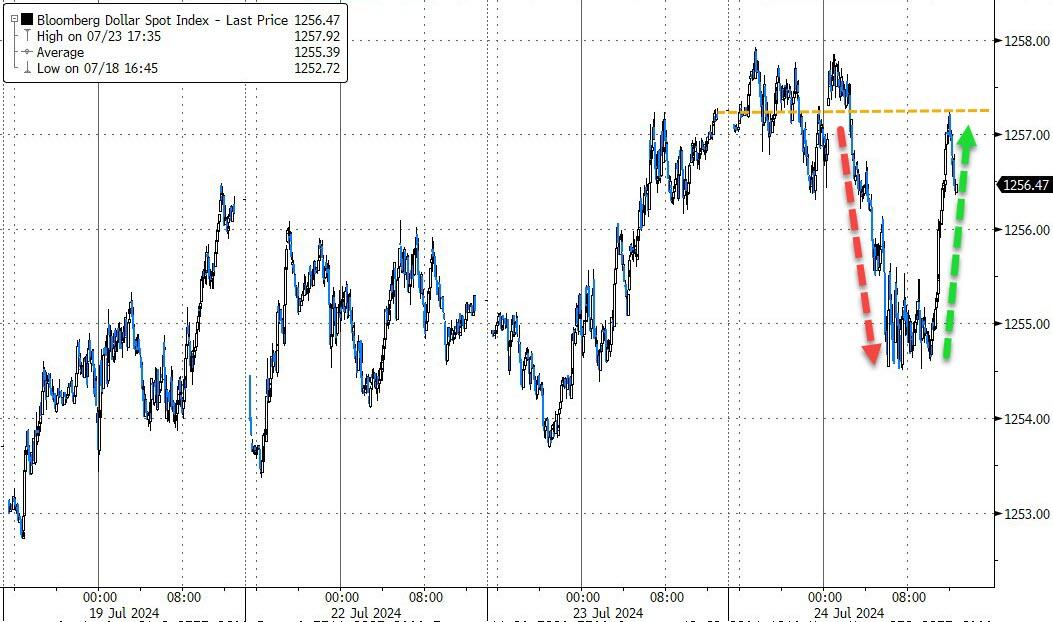
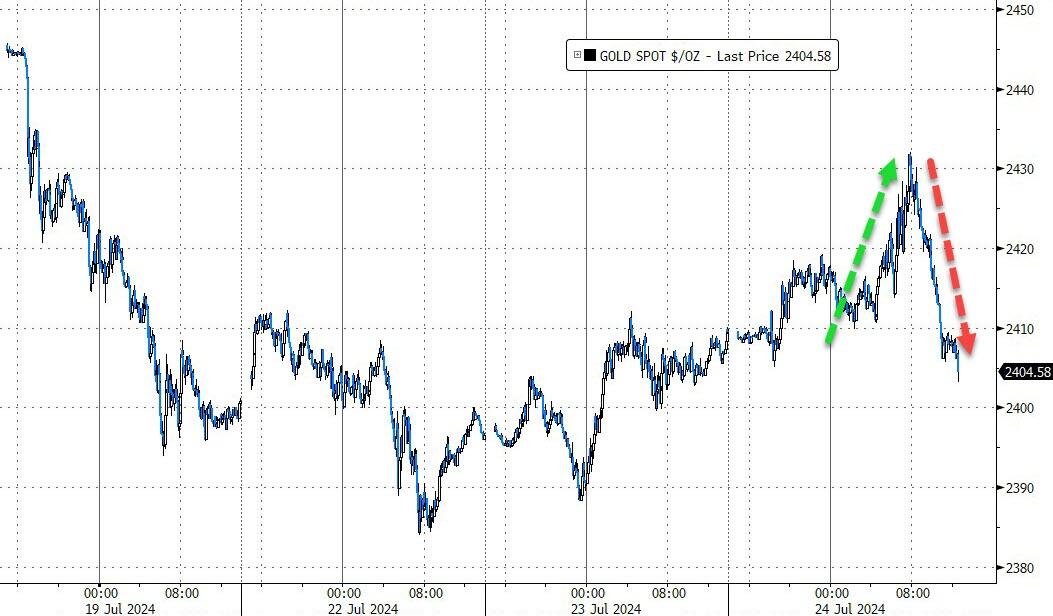
Further compounding the negative sentiment were new home sales for June, which came in lighter than anticipated, with the year-to-date number now at -7.4%. Despite the equity sell-off, bond yields rose, the dollar whipsawed but ended the session unchanged, and gold mirrored the currency’s movement but closed modestly lower.
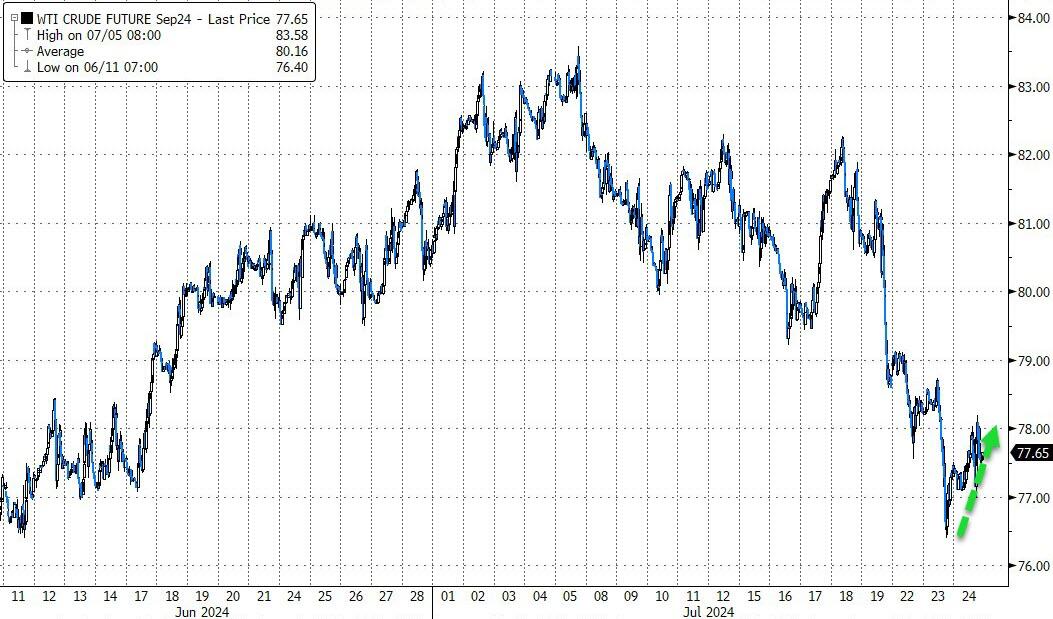
Crude oil prices meandered higher but remained near their six-week lows. Only Bitcoin defied the bearish trend by closing up slightly.
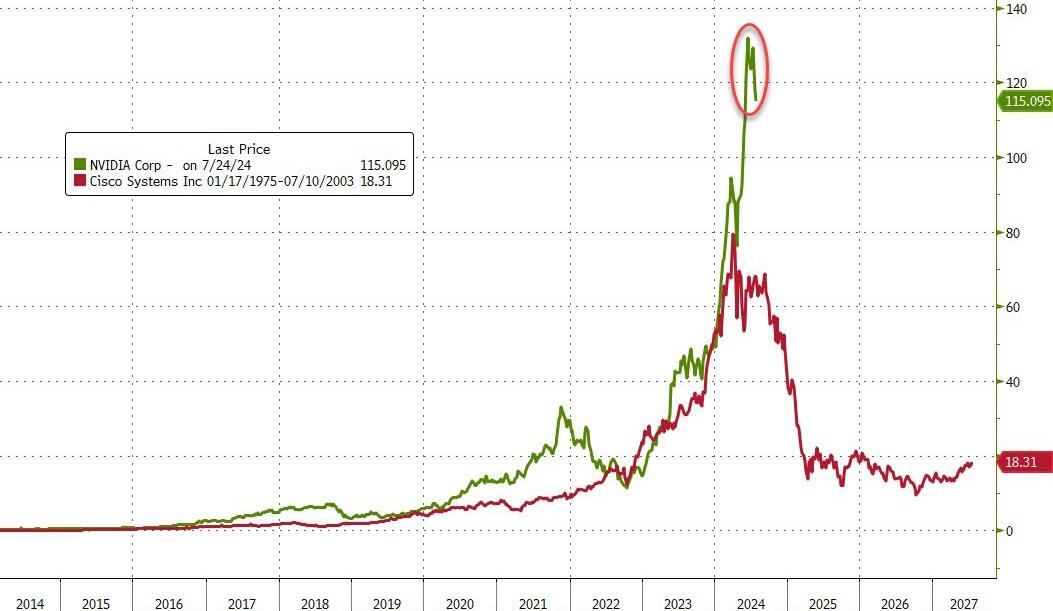
Today’s sharp and broad correction raises an important question:
Is the comparison between Cisco Systems and Nvidia still valid?
2. Current “Buy” Cycles (effective 11/21/2023)
Our Trend Tracking Indexes (TTIs) have both crossed their trend lines with enough strength to trigger new “Buy” signals. That means, Tuesday, 11/21/2023, was the official date for these signals.
If you want to follow our strategy, you should first decide how much you want to invest based on your risk tolerance (percentage of allocation). Then, you should check my Thursday StatSheet and Saturday’s “ETFs on the Cutline” report for suitable ETFs to buy.
3. Trend Tracking Indexes (TTIs)
Today’s trading session was marked by a strong bearish presence, which significantly impacted the market. The tech sector, along with stocks in general, faced considerable pressure as the bears took control.
This widespread downturn did not spare our TTIs, which also experienced a synchronized retreat.
This is how we closed 07/24/2024:
Domestic TTI: +5.60% above its M/A (prior close +6.85%)—Buy signal effective 11/21/2023.
International TTI: +6.00% above its M/A (prior close +7.02%)—Buy signal effective 11/21/2023.
All linked charts above are courtesy of Bloomberg via ZeroHedge.
———————————————————-
WOULD YOU LIKE TO HAVE YOUR INVESTMENTS PROFESSIONALLY MANAGED?
Do you have the time to follow our investment plans yourself? If you are a busy professional who would like to have his portfolio managed using our methodology, please contact me directly to get more details.
Contact Ulli