
ETF Tracker StatSheet
You can view the latest version here.
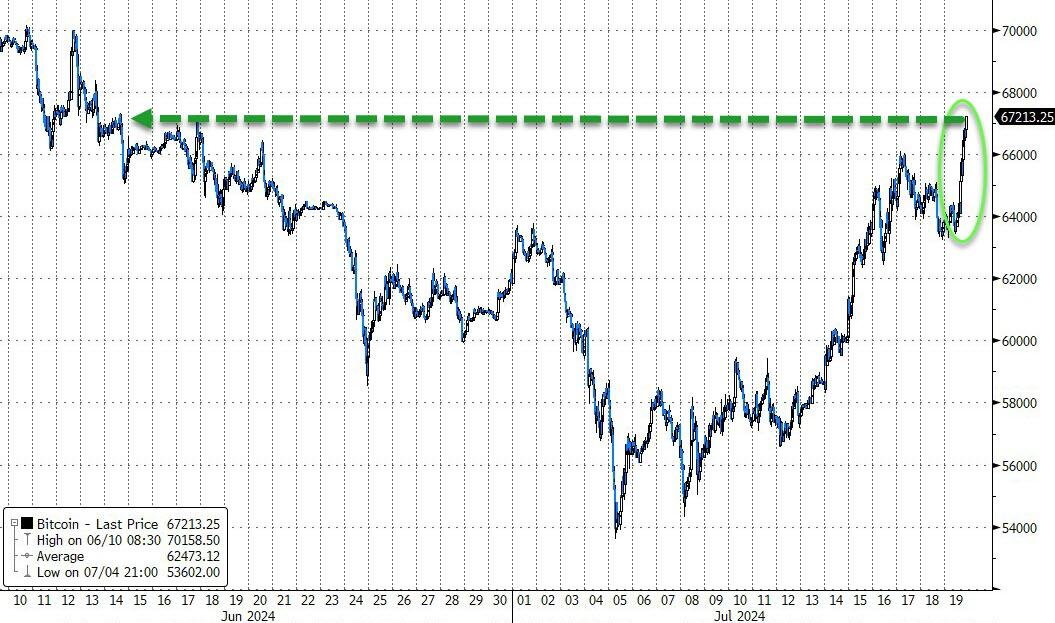
BITCOIN BREAKS $67K AS TECH STOCKS FALTER AND BOND YIELDS RISE
- Moving the markets
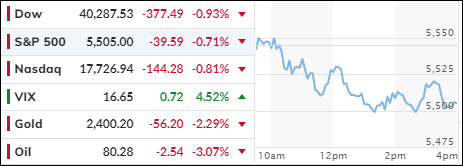
The downward trend persisted today, leaving traders likely relieved that the week is finally over. Earlier hopes for an easing of interest rates had prompted a rotation out of tech stocks and into broader markets like Small Caps, which stand to benefit the most from such policy changes.
However, when considering the bigger picture, this week’s losses were moderate compared to the gains the major indexes have accumulated year-to-date. The S&P 500 ended the week down around 2%, marking its worst performance since April, while the Nasdaq slipped over 3%. These declines were somewhat offset by the Dow’s 0.6% advance and the Small Caps’ 2% gain.
The shift away from technology stocks was necessary, as traders and investors had become overly reliant on a few high-performing stocks. The reality set in that this dependence is unsustainable, and for any bullish scenario to be maintained over time, the broader market must participate.
Adding to the market’s woes, today’s significant IT outage, with CrowdStrike unintentionally hinting at the possible existence of an internet kill switch with global impact, did not inspire confidence among traders.
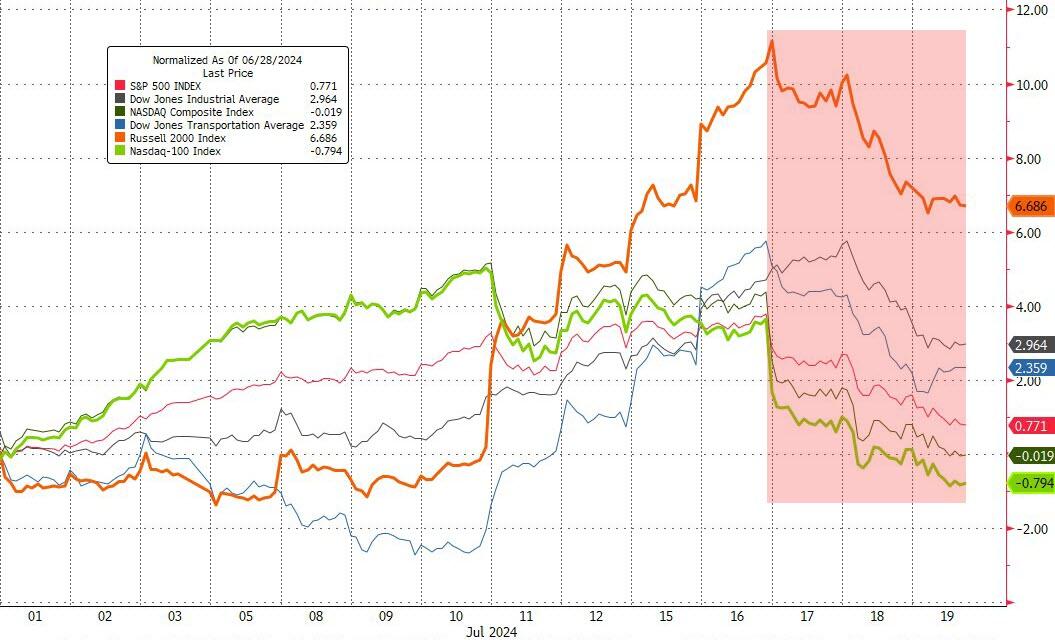
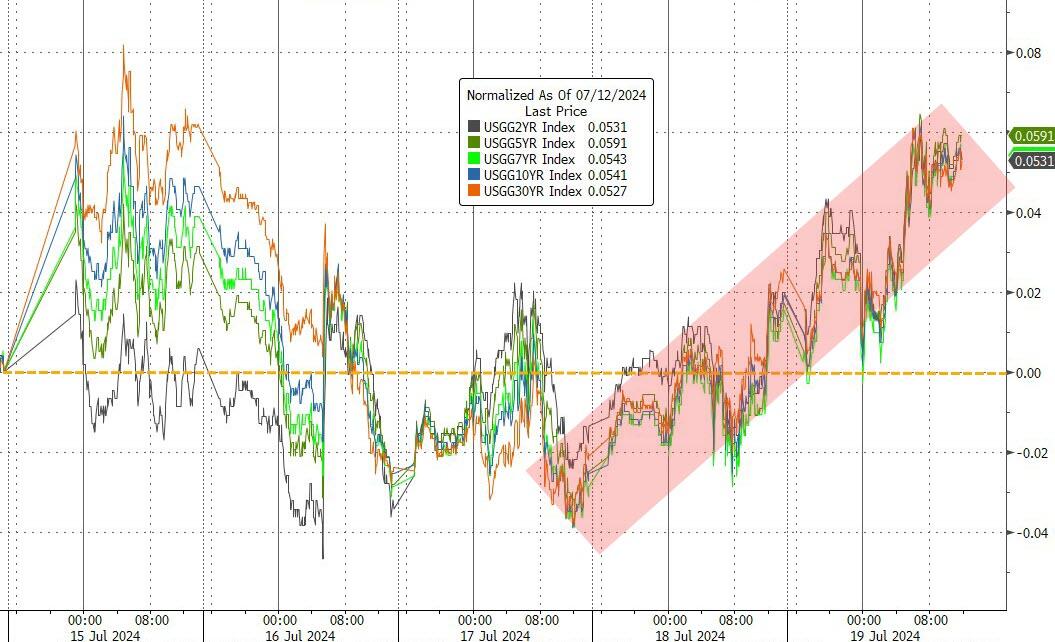
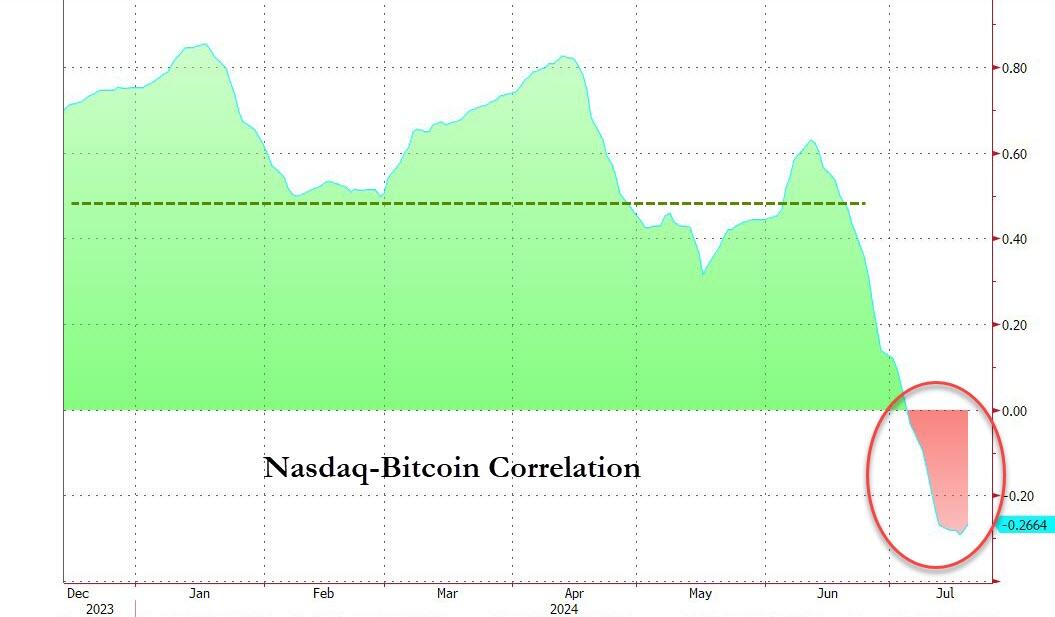
Despite this week’s pullback affecting all indexes, Small Caps remain the clear winner for July with an almost 7% gain, while the Nasdaq has dipped slightly into the red. Bond yields rose, and Bitcoin rallied for the second consecutive week, climbing above $67k for the first time in six weeks, decoupling from its strong correlation with the tech sector.
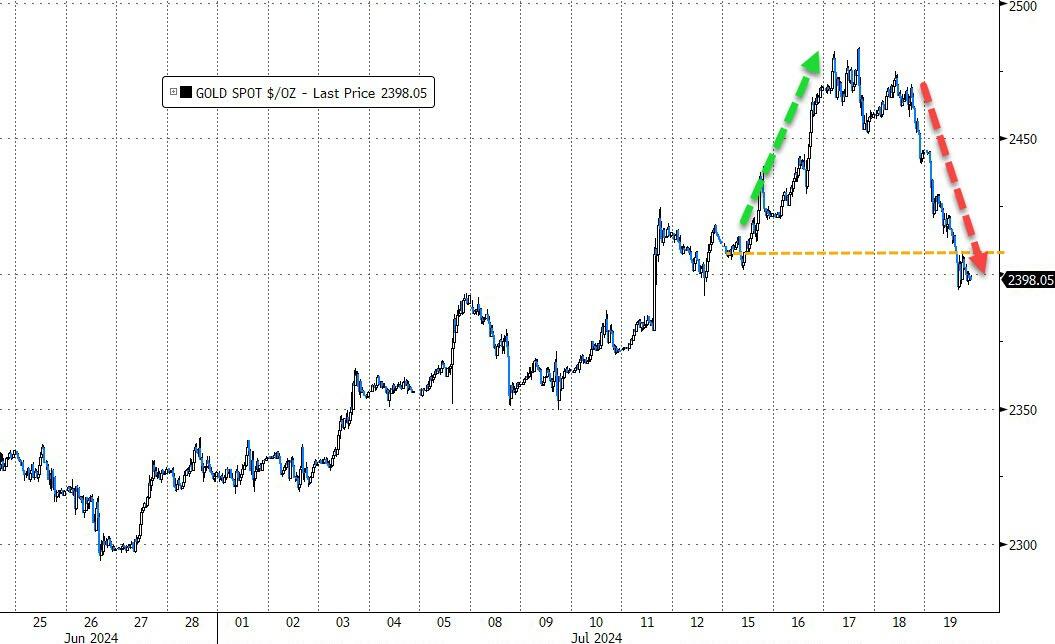
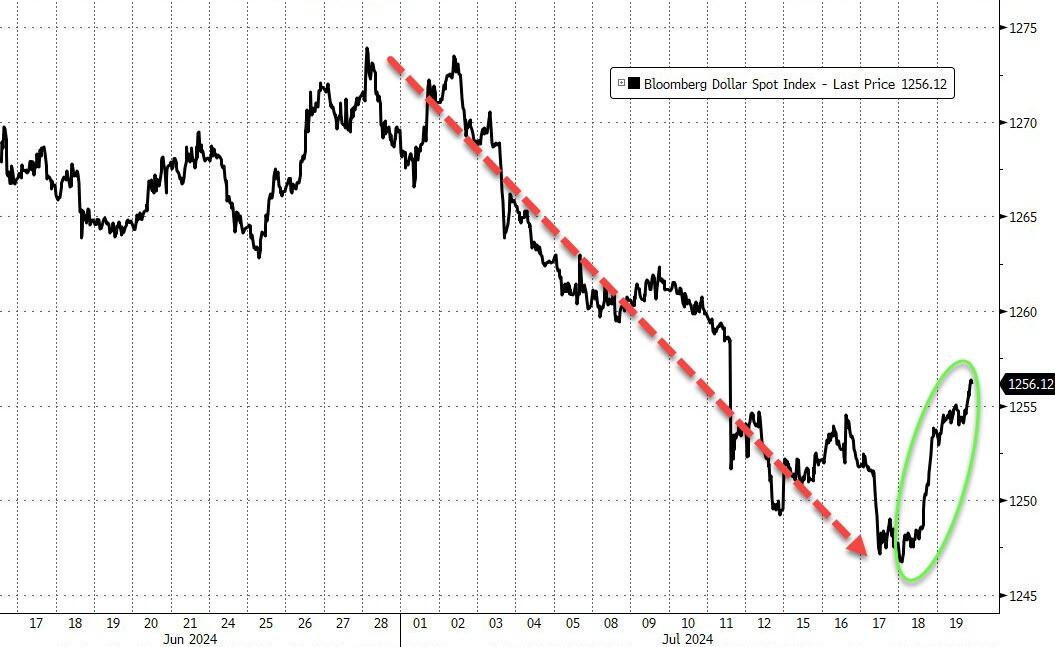
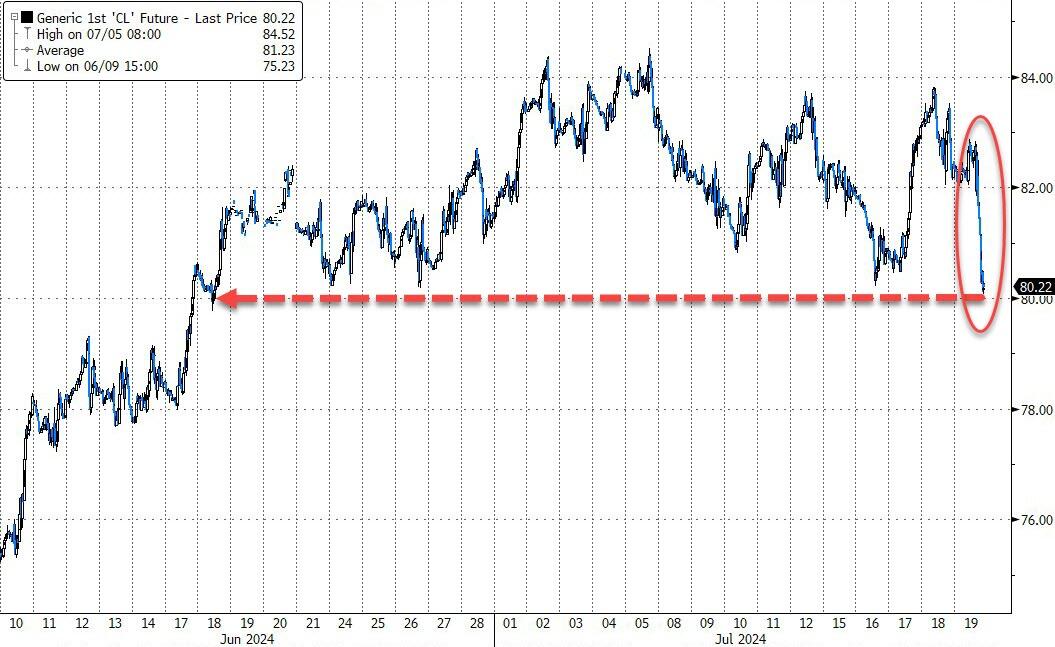
Gold struggled, giving back all its early-week gains and ending the week nearly unchanged. Meanwhile, the dollar found a bottom and had its best week since early June, which negatively impacted crude oil, pushing it back to the $80 level.
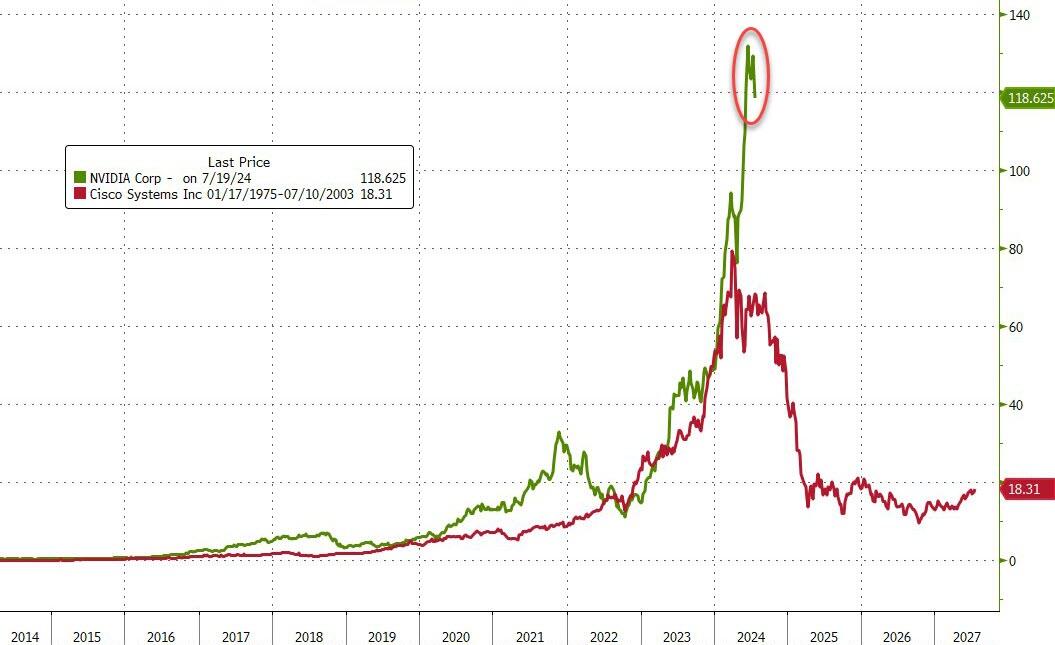
Reflecting on historical precedents, such as the comparison between Cisco Systems and Nvidia, I wonder: Will reality eventually overcome the current hype?
2. Current “Buy” Cycles (effective 11/21/2023)
Our Trend Tracking Indexes (TTIs) have both crossed their trend lines with enough strength to trigger new “Buy” signals. That means, Tuesday, 11/21/2023, was the official date for these signals.
If you want to follow our strategy, you should first decide how much you want to invest based on your risk tolerance (percentage of allocation). Then, you should check my Thursday StatSheet and Saturday’s “ETFs on the Cutline” report for suitable ETFs to buy.
3. Trend Tracking Indexes (TTIs)
Today, the major indexes struggled to gain any traction and ultimately ended the week on a down note.
Unfortunately, our TTIs were also unable to resist the prevailing market trend, resulting in a moderate decline.
This is how we closed 07/19/2024:
Domestic TTI: +6.39% above its M/A (prior close +7.69%)—Buy signal effective 11/21/2023.
International TTI: +6.51% above its M/A (prior close +8.03%)—Buy signal effective 11/21/2023.
All linked charts above are courtesy of Bloomberg via ZeroHedge.
———————————————————-
WOULD YOU LIKE TO HAVE YOUR INVESTMENTS PROFESSIONALLY MANAGED?
Do you have the time to follow our investment plans yourself? If you are a busy professional who would like to have his portfolio managed using our methodology, please contact me directly to get more details.
Contact Ulli