
- Moving the markets
The markets opened mixed, as the latest stats showed a weakening labor market ahead of Friday’s eagerly expected payroll report. ADP’s data confirmed less private payroll growth than hoped for in June, while at the same time weekly jobless claims numbers were higher than anticipated.
To me, that is no surprise, since almost daily I am hearing of mass layoffs around the country. Today’s session was a shortened one with the markets closing at 1 pm ET. Afterwards, traders still will look at the minutes from the Fed’s June committee meeting.
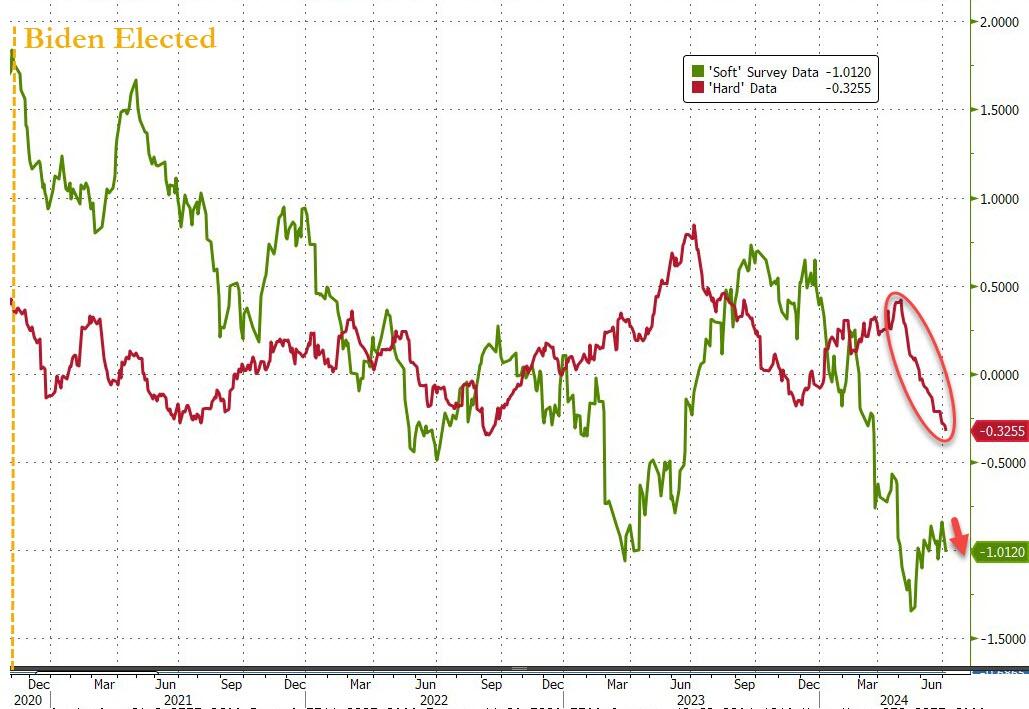
Tesla continued its march higher by rising another 3% after a better-than-expected delivery report. That helped to maintain a bullish stance, and the major indexes took off. More collapsing “hard” and “soft” data supported the viewpoint that the Fed is getting closer to loosening monetary policy.
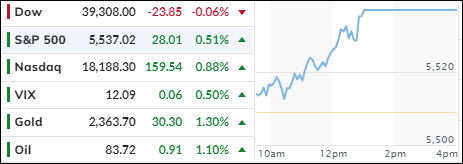
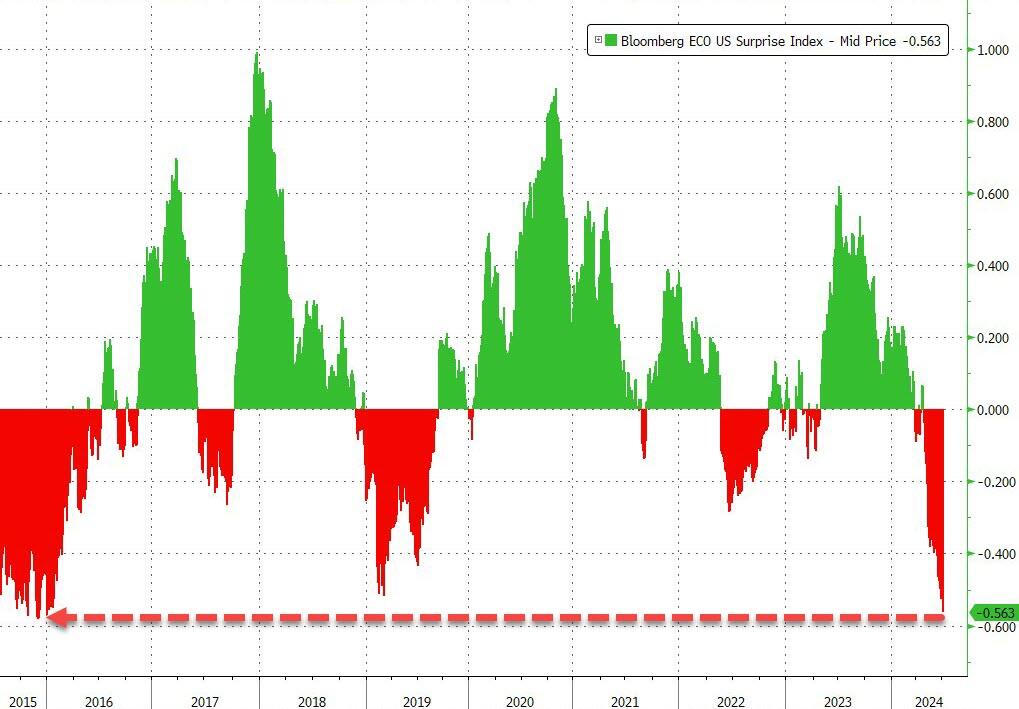
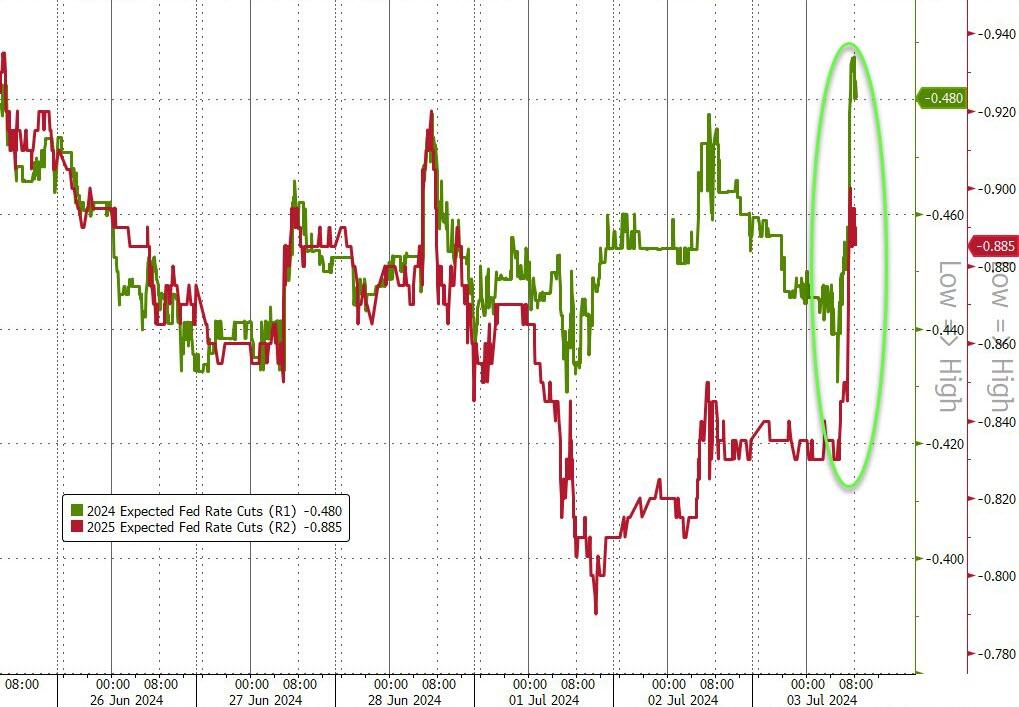
As a result, bad news was good news for the markets with the US macro surprise index tanking and closing at its weakest since December 2015, which sent rate-cut expectations soaring. The S&P 500 and the Nasdaq followed suit, while the Dow ended unchanged.
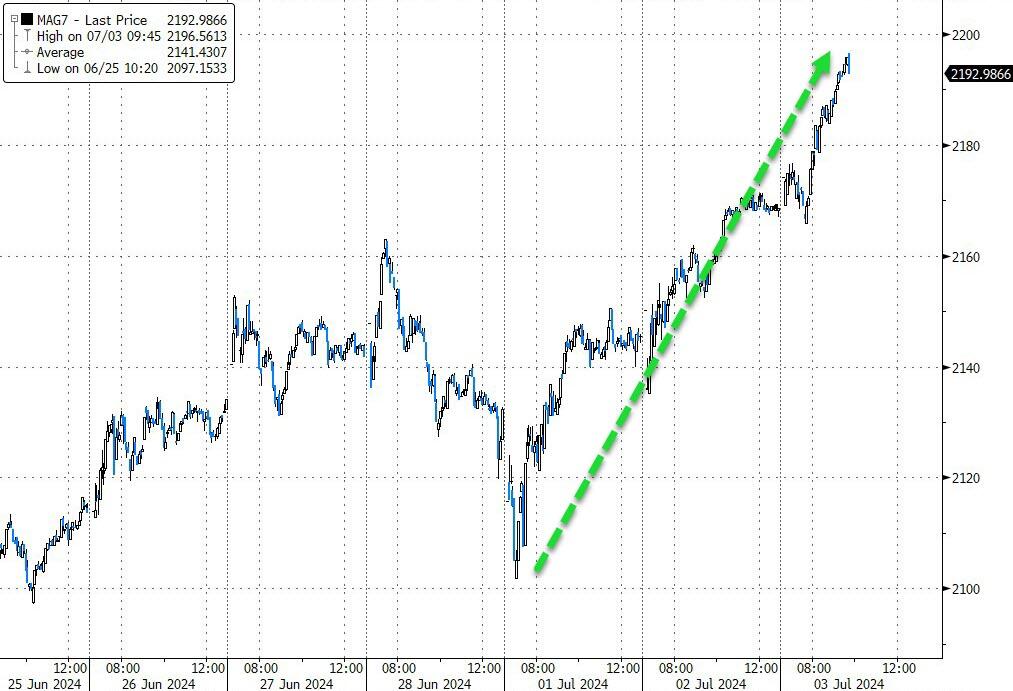
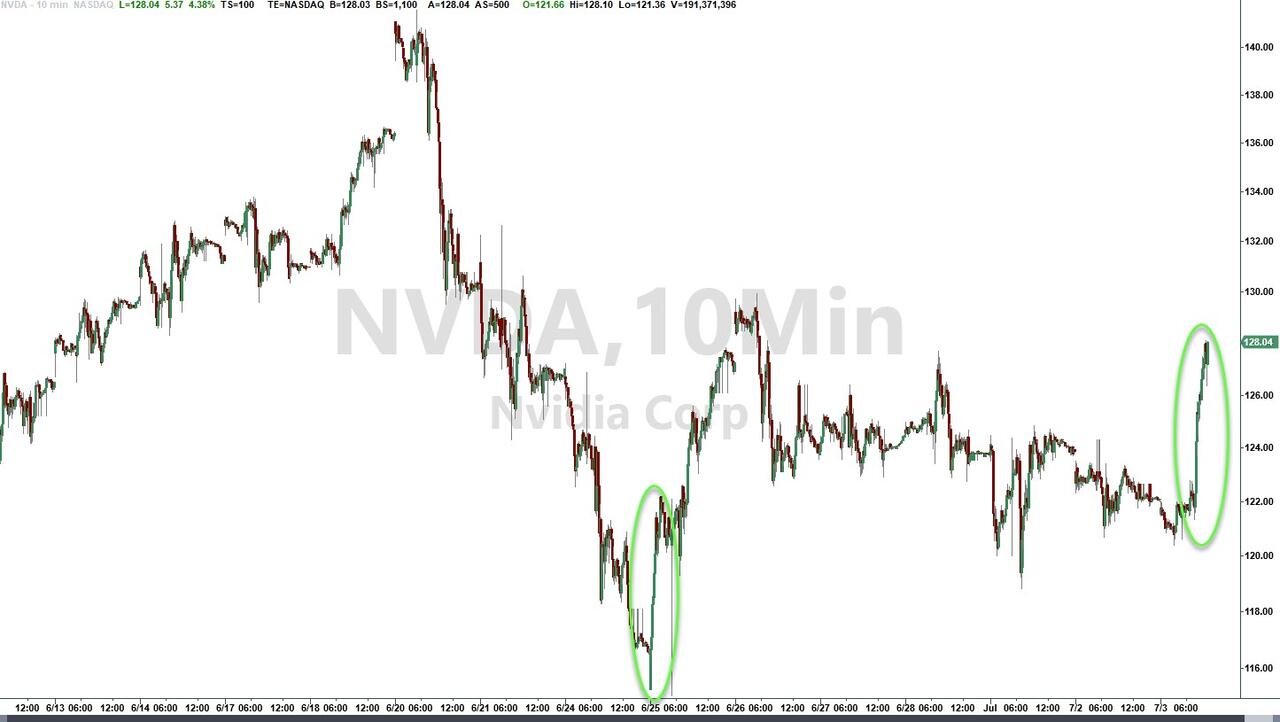
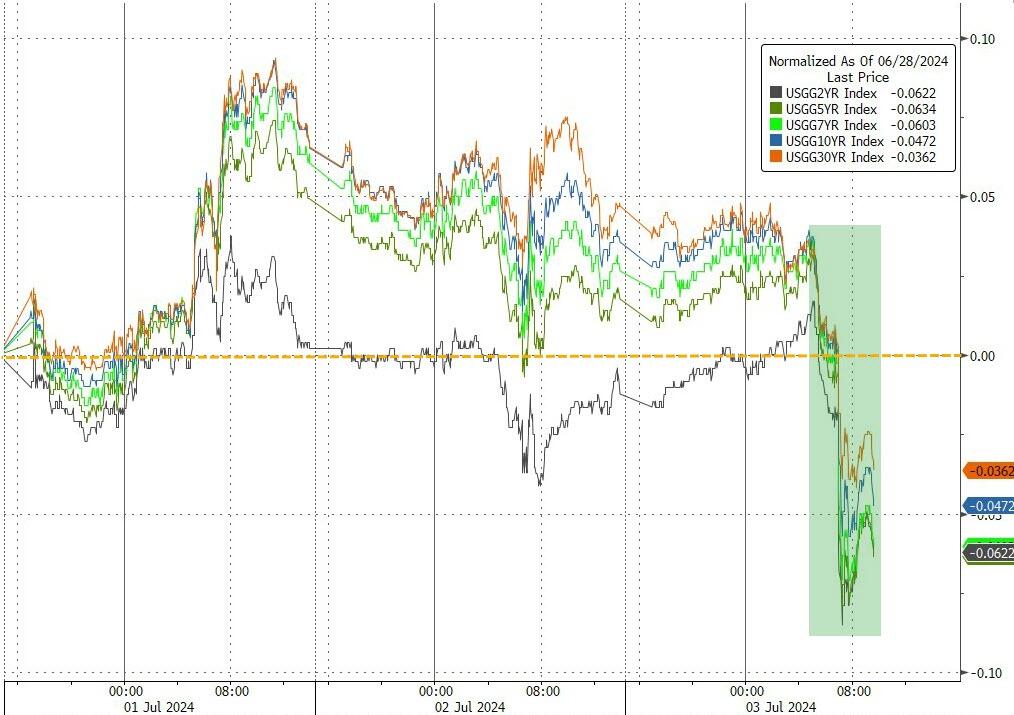
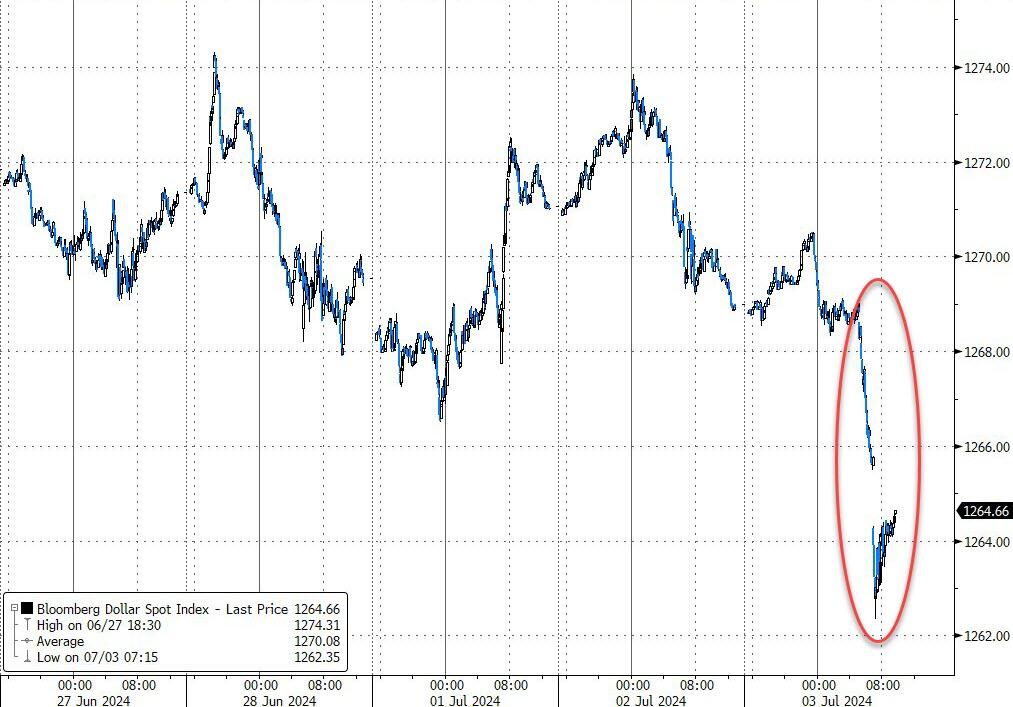
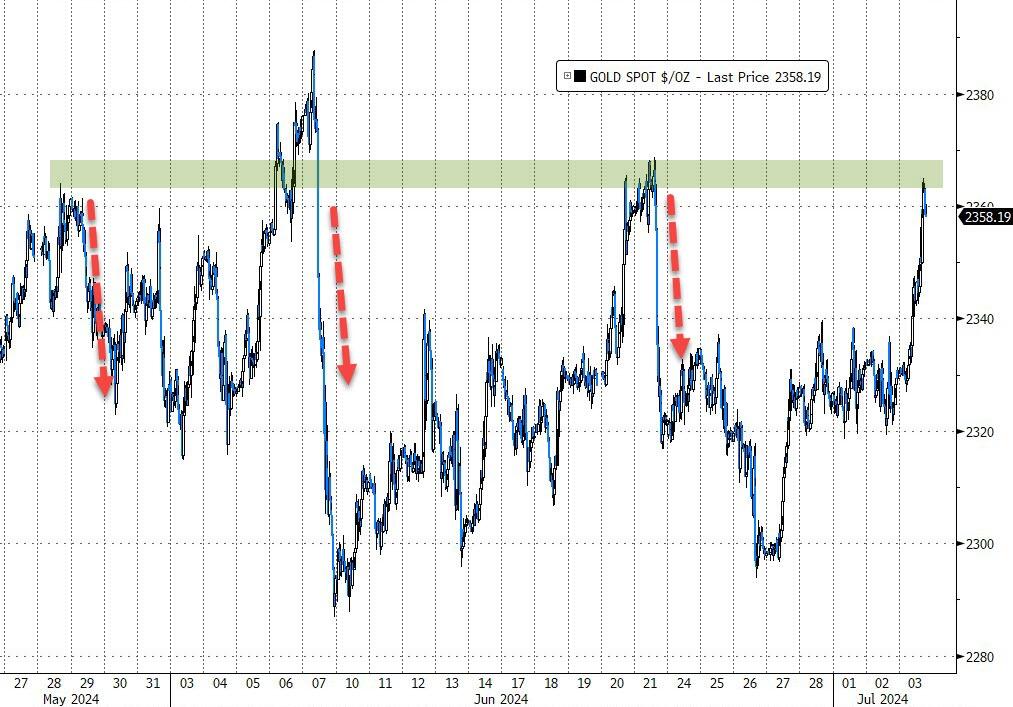
The MAG7 stocks continued the upward swing, a move that was supported by Nvidia, thanks in part to sinking bond yields. Lower yields spelled trouble for the dollar, but it helped gold spike to its resistance level, as the precious metal gained 1.3%.
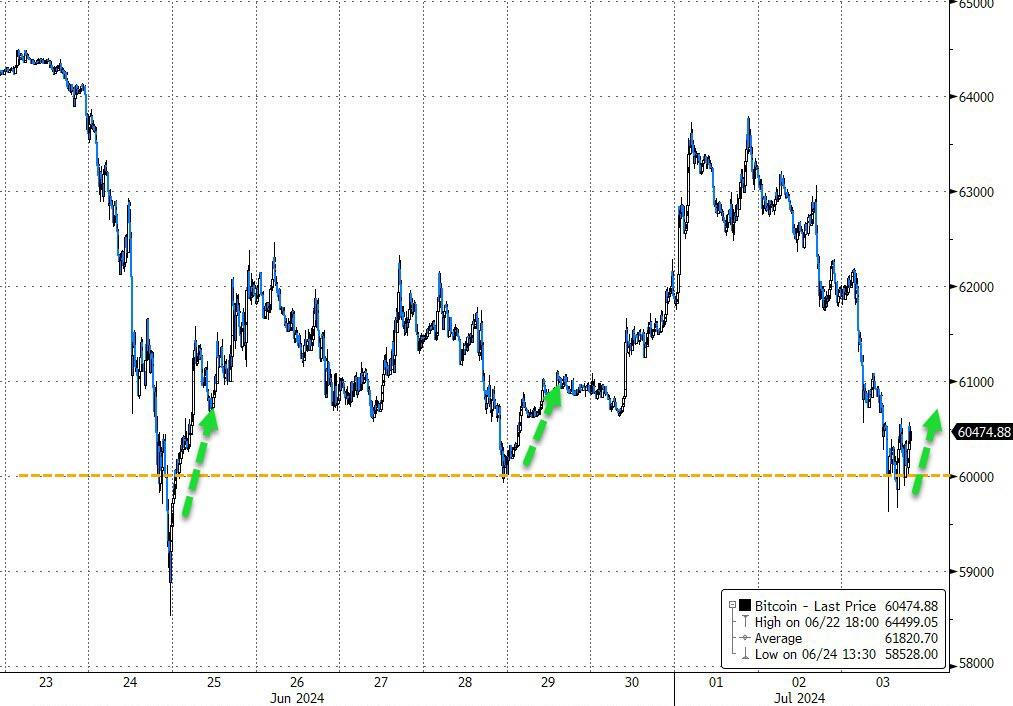
Bitcoin lost its mojo but found support at its $60k level, while oil prices rode the roller coaster but closed 1% higher.
It’s now obvious that jobless claims are rising as the economy is rolling over. That will negatively affect future corporate earnings.
Why?
Because higher unemployment means lower demand for products and services, which in turn may lead to more layoffs, which in the end will decrease stock values.
On a personal note, I will be out of town for a few days but will be back for Monday’s market commentary.
Happy 4th of July!
2. Current “Buy” Cycles (effective 11/21/2023)
Our Trend Tracking Indexes (TTIs) have both crossed their trend lines with enough strength to trigger new “Buy” signals. That means, Tuesday, 11/21/2023, was the official date for these signals.
If you want to follow our strategy, you should first decide how much you want to invest based on your risk tolerance (percentage of allocation). Then, you should check my Thursday StatSheet and Saturday’s “ETFs on the Cutline” report for suitable ETFs to buy.
3. Trend Tracking Indexes (TTIs)
Two of the three major indexes scored another winning session, while the Dow meandered and went nowhere.
Our TTIs were in tune with the overall positive momentum and marched deeper into bullish territory.
This is how we closed 07/03/2024:
Domestic TTI: +4.96% above its M/A (prior close +4.92%)—Buy signal effective 11/21/2023.
International TTI: +7.43% above its M/A (prior close +6.77%)—Buy signal effective 11/21/2023.
All linked charts above are courtesy of Bloomberg via ZeroHedge.
———————————————————-
WOULD YOU LIKE TO HAVE YOUR INVESTMENTS PROFESSIONALLY MANAGED?
Do you have the time to follow our investment plans yourself? If you are a busy professional who would like to have his portfolio managed using our methodology, please contact me directly to get more details.
Contact Ulli