

- Moving the markets
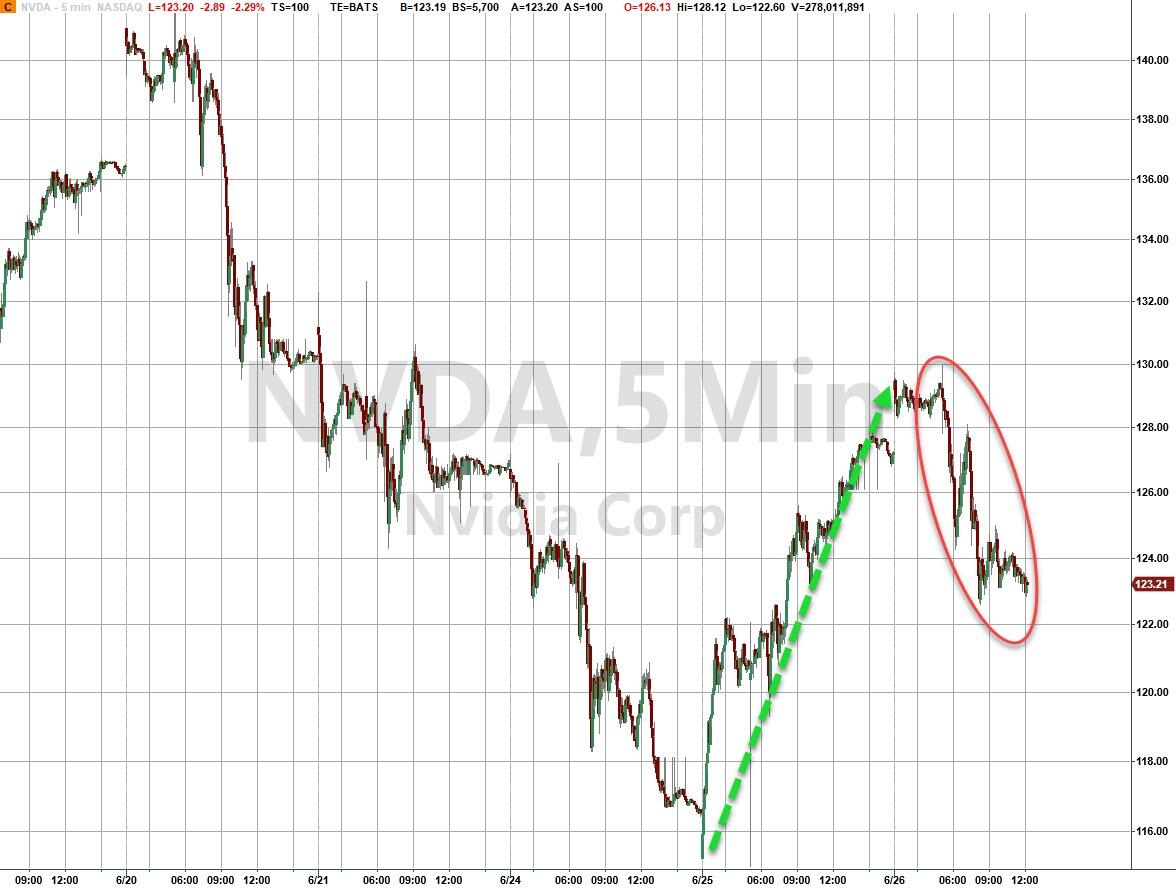
Two of the three major indexes slipped early on, while the Nasdaq powered higher, as Nvidia edged up another 1% on top of Tuesday’s 7% gain. However, it had given most of it back by the time the closing bell rang.
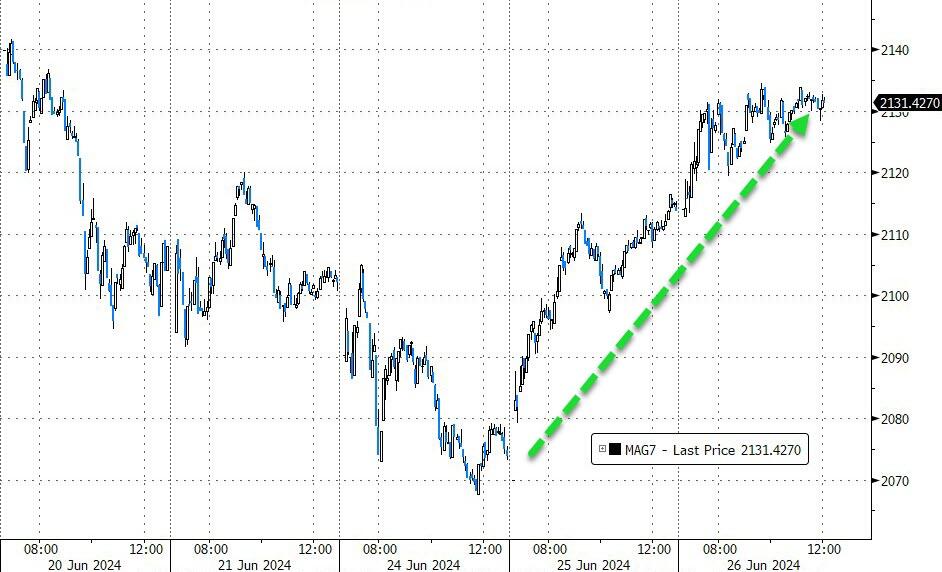
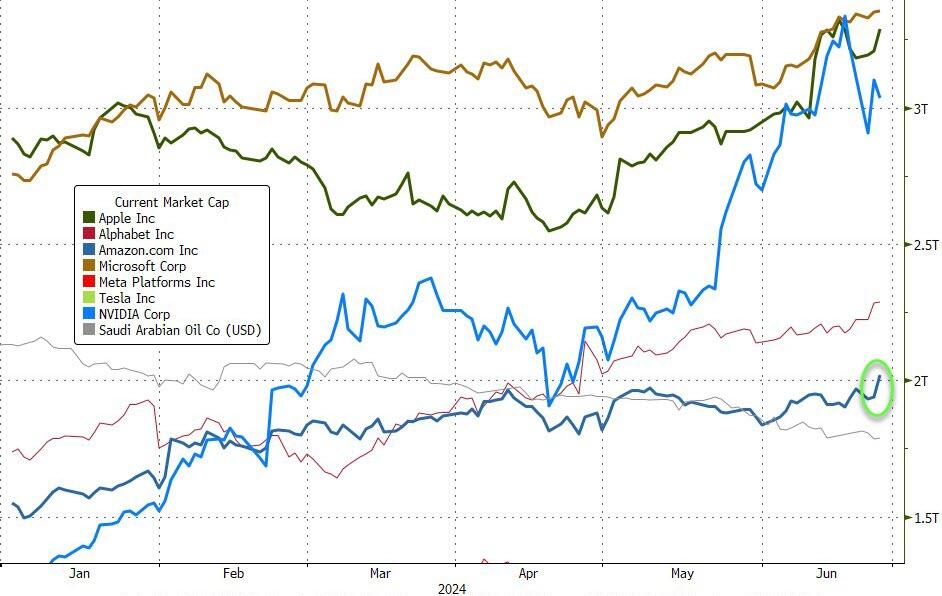
The MAG 7 stocks bucked that wild ride and continued yesterday’s path higher on a smooth trajectory. Amazon was in the news as well, with the retail giant topping its $2 trillion market cap for the first time.
The S&P 500, despite notching a few losing sessions recently, is on track to close out the first half of the year with a gain of some 15%. That performance was due to the tech sector’s surge with Nvidia being up some 150% for the same period.
Of course, speculation runs rampant whether the recent pullback means the end of the bullish runup. After all, the S&P 500 is trading within 1% of what many strategists have considered to be its year-ending price level.
The broad market’s sluggishness is likely tied to trader anxiety about Friday’s inflation data release, namely the Fed’s favorite gauge, the PCE (Personal Consumption Expenditure price index). If this reading comes in lower than expected, Wall Street will rejoice and continue to push their agenda that rate cuts are on the horizon.
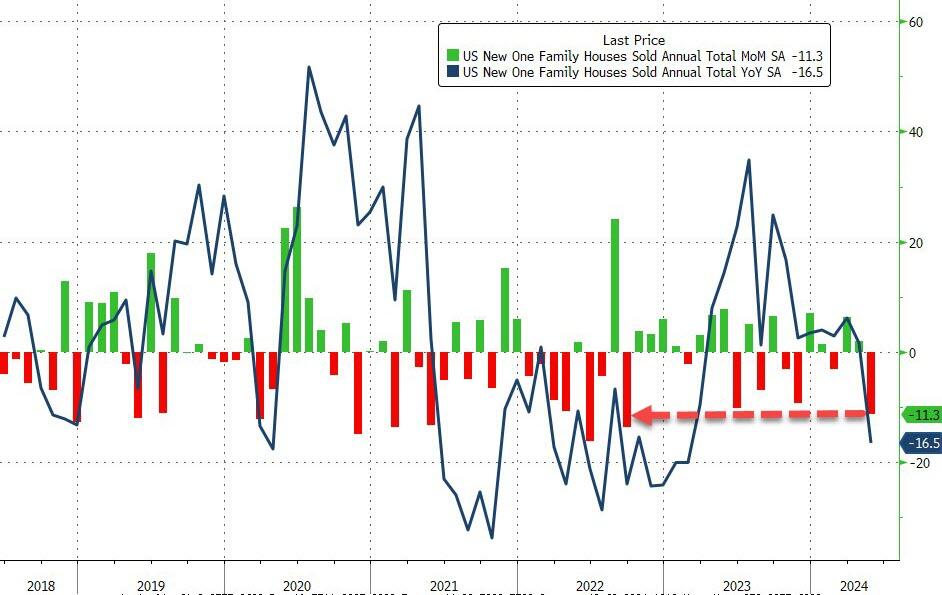
Today’s new home sales were a disaster, with markets literally imploding in May, as sales crashed 11.3% MoM, which was its biggest drop since September 2022. Median new home prices fell 0.9% YoY to their lowest since April 2023.
Mortgage rates have consistently remained above 7%, placing pressure on the Federal Reserve to intervene and provide relief to the housing market.
However, the Fed faces a challenging dilemma: lowering rates to stimulate the housing market could inadvertently fuel inflation to potentially unprecedented heights.
Not a good alternative.
2. Current “Buy” Cycles (effective 11/21/2023)
Our Trend Tracking Indexes (TTIs) have both crossed their trend lines with enough strength to trigger new “Buy” signals. That means, Tuesday, 11/21/2023, was the official date for these signals.
If you want to follow our strategy, you should first decide how much you want to invest based on your risk tolerance (percentage of allocation). Then, you should check my Thursday StatSheet and Saturday’s “ETFs on the Cutline” report for suitable ETFs to buy.
3. Trend Tracking Indexes (TTIs)
The Nasdaq again led the pack, as the tech sector found some footing, with the S&P 500 and Dow following suit.
The rally was not broad based, so our TTIs pulled back a tad.
This is how we closed 06/26/2024:
Domestic TTI: +5.10% above its M/A (prior close +5.49%)—Buy signal effective 11/21/2023.
International TTI: +6.80% above its M/A (prior close +7.03%)—Buy signal effective 11/21/2023.
All linked charts above are courtesy of Bloomberg via ZeroHedge.
———————————————————-
WOULD YOU LIKE TO HAVE YOUR INVESTMENTS PROFESSIONALLY MANAGED?
Do you have the time to follow our investment plans yourself? If you are a busy professional who would like to have his portfolio managed using our methodology, please contact me directly to get more details.
Contact Ulli