
- Moving the markets
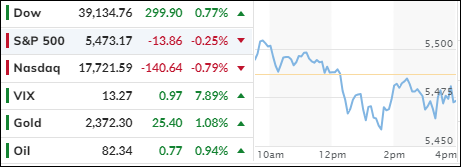
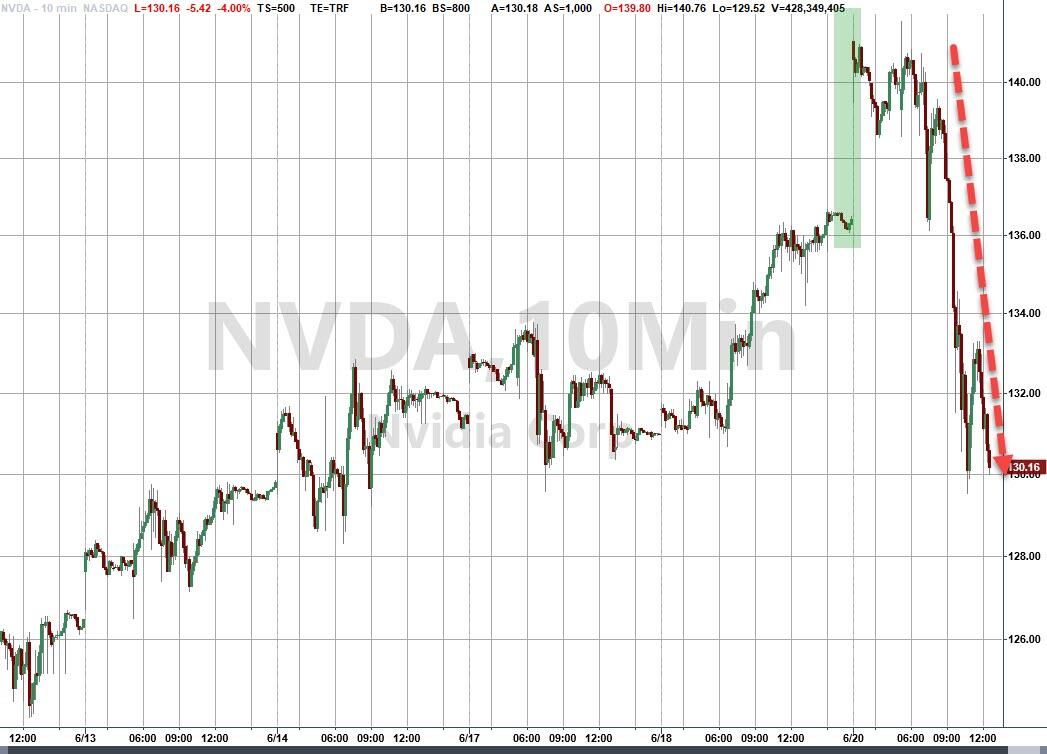
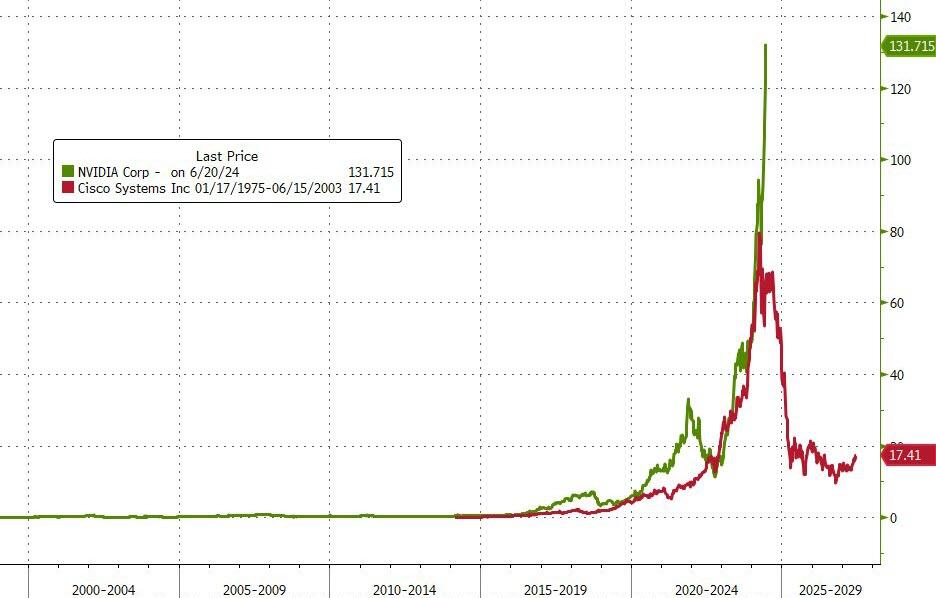
For a moment, we saw the S&P 500 trade above its 5,500 level, as the tech rally continued unabated with Nvidia in the lead. However, during this session the tech darling took a dive and scored its worst day in two months. Is it starting to look toppy?
In the end, the S&P 500 and Nasdaq were not able to hold on and closed in the red.
The AI boom is in full swing and remains the main driver of this rally, despite consumers reducing their spending and the economy’s weakness becoming more apparent every day.
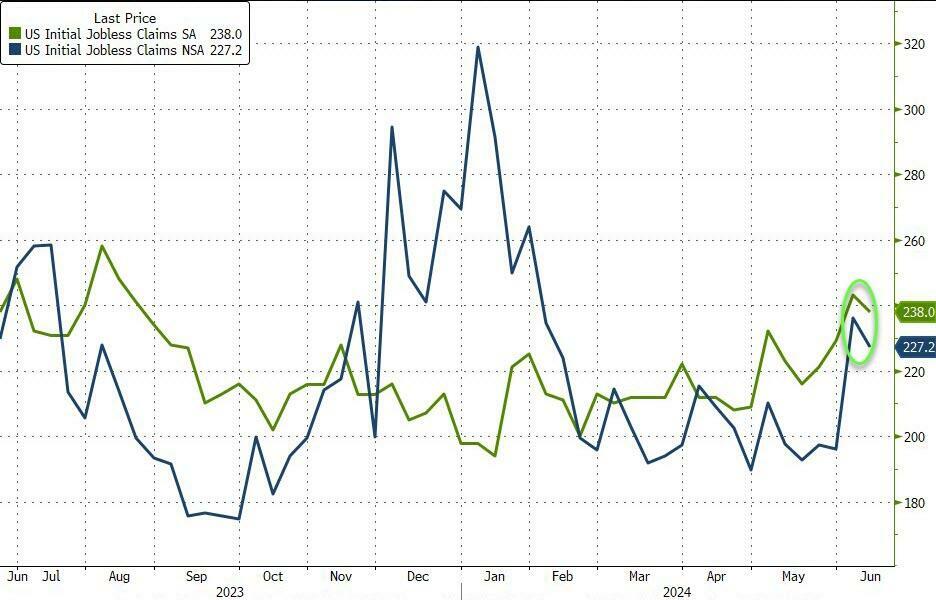
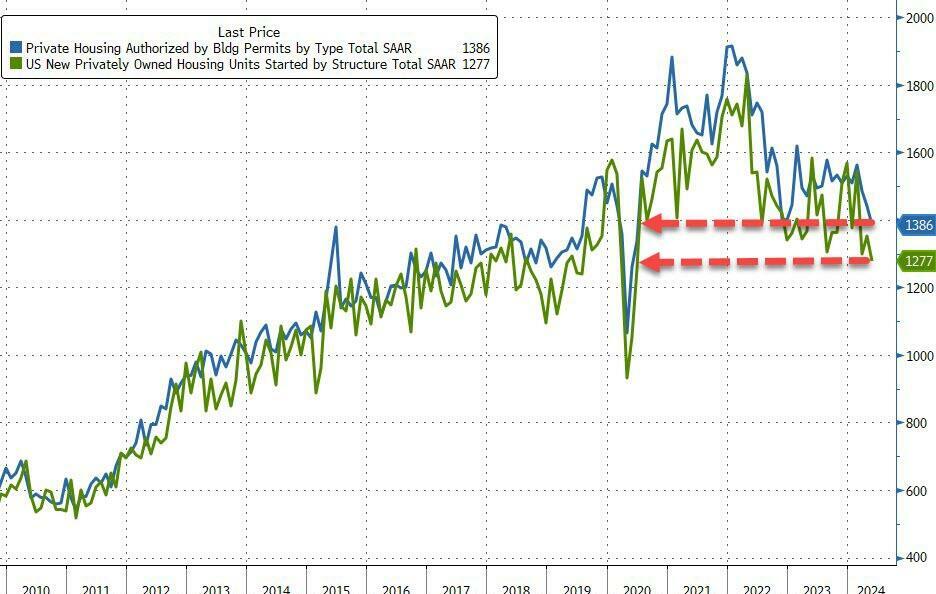
Today, the latest data showed higher-than-expected weekly jobless claims along with reduced housing starts and permits. Manufacturing also took a hit and dropped below expectations, while the Economic Surprise index dove to its lowest since early 2019.
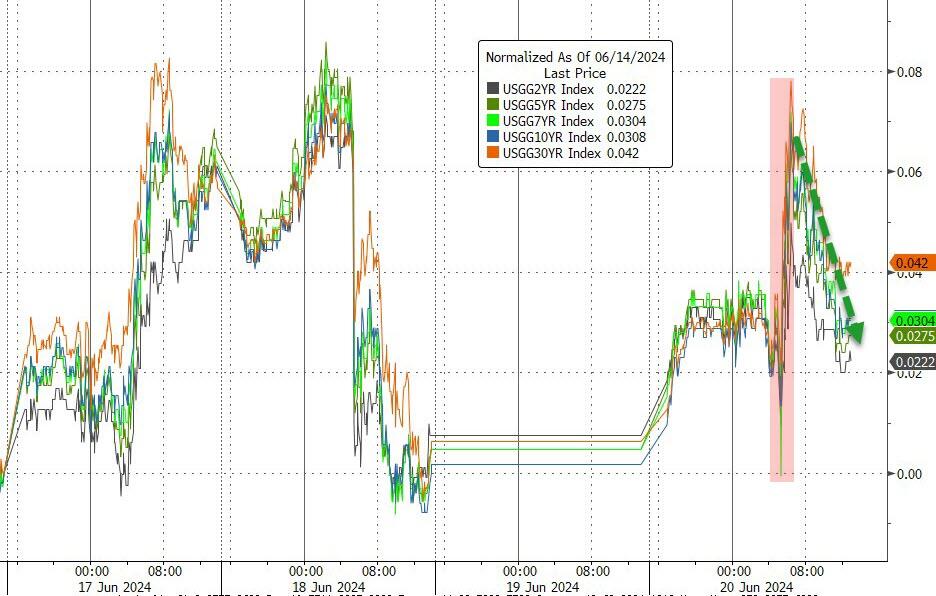
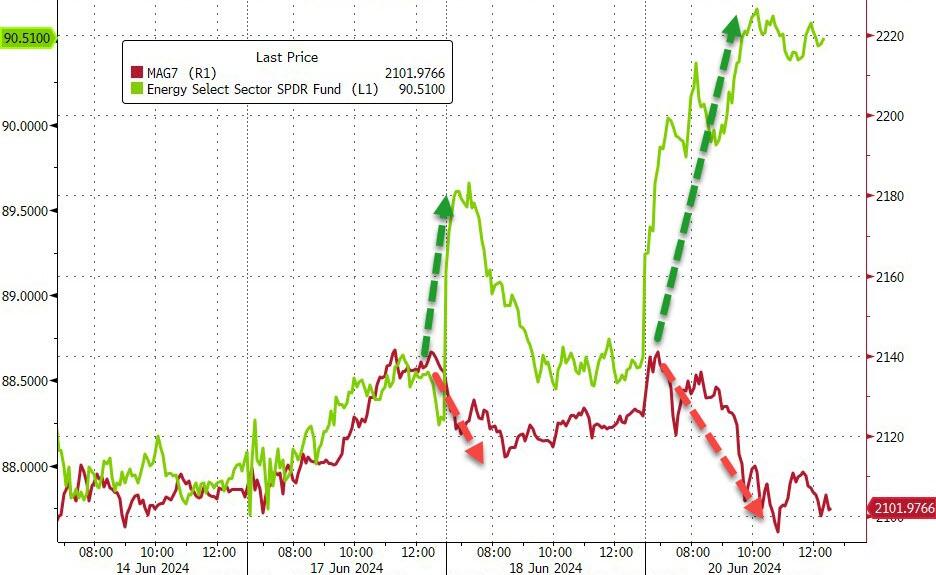
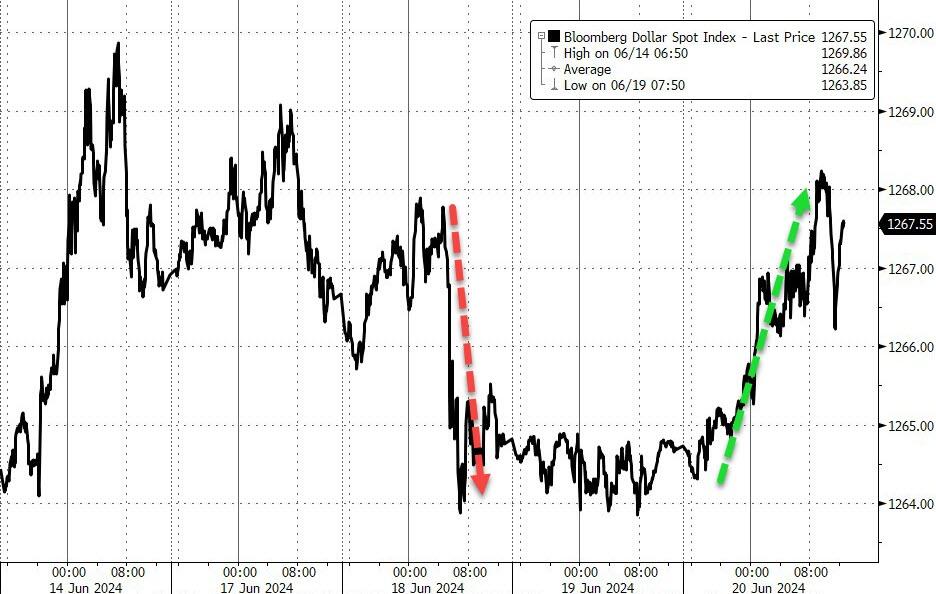
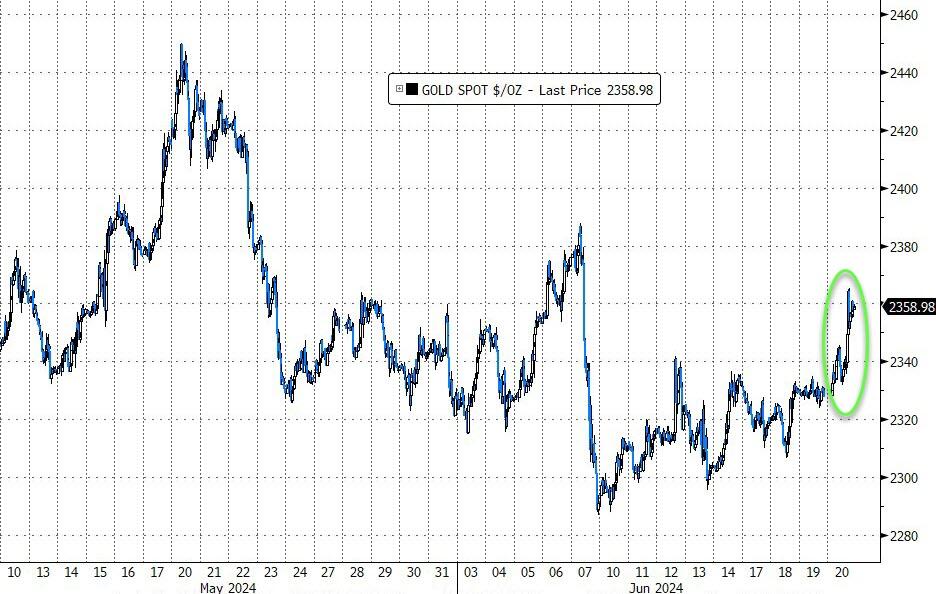
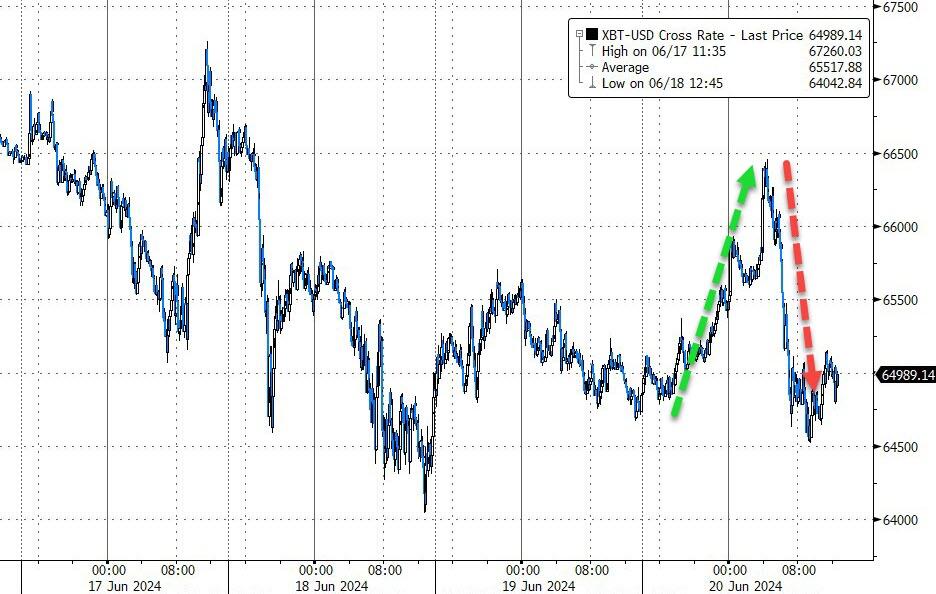
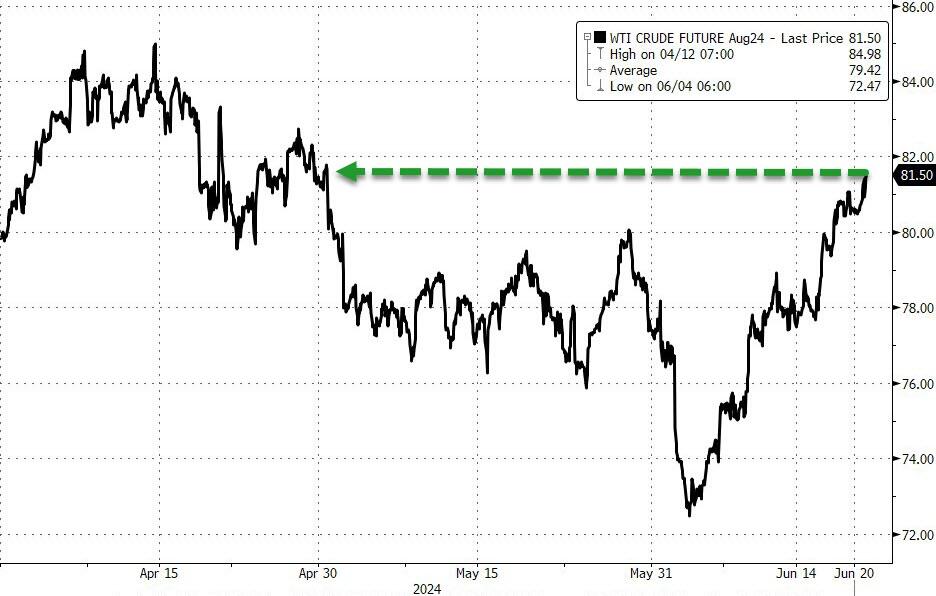
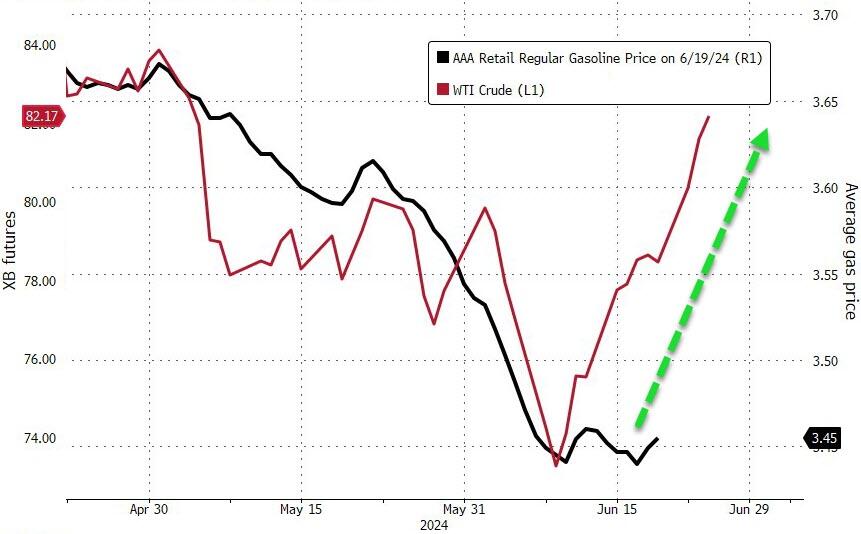
Bond yields rose a tad, as energy outperformed the MAG 7 stocks over the last 2 days. The dollar rebounded, and surprisingly gold followed the same path, while Bitcoin rode the rollercoaster and ended the session unchanged. Crude oil rocketed to a level last seen in April, which means prices at the pump will see a hike.
None of this seems to matter to the markets even with breadth being conspicuously absent, which means that only a few stocks are supporting the indexes and their relentless march into uncharted territory. This blow-off phase may go on a while longer, but it will not end well.
Traders’ eyes are now focused on tomorrow’s largest option expiration ever, with $5.1 trillion of options expiring along with a record $870 billion in single stock options.
While volatility might rear its ugly head, nothing could go wrong there, right?
2. Current “Buy” Cycles (effective 11/21/2023)
Our Trend Tracking Indexes (TTIs) have both crossed their trend lines with enough strength to trigger new “Buy” signals. That means, Tuesday, 11/21/2023, was the official date for these signals.
If you want to follow our strategy, you should first decide how much you want to invest based on your risk tolerance (percentage of allocation). Then, you should check my Thursday StatSheet and Saturday’s “ETFs on the Cutline” report for suitable ETFs to buy.
3. Trend Tracking Indexes (TTIs)
After an early bounce, two of the three major indexes slipped into the red with only the Dow scoring a solid green close.
Our TTI’s trod water but ended the session a tad higher.
This is how we closed 06/20/2024:
Domestic TTI: +6.42% above its M/A (prior close +6.36%)—Buy signal effective 11/21/2023.
International TTI: +7.35% above its M/A (prior close +6.88%)—Buy signal effective 11/21/2023.
All linked charts above are courtesy of Bloomberg via ZeroHedge.
———————————————————-
WOULD YOU LIKE TO HAVE YOUR INVESTMENTS PROFESSIONALLY MANAGED?
Do you have the time to follow our investment plans yourself? If you are a busy professional who would like to have his portfolio managed using our methodology, please contact me directly to get more details.
Contact Ulli