
- Moving the markets
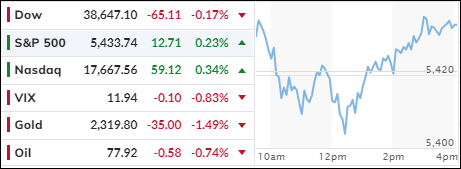
The major indexes wavered with the Dow being the weakling of the day, despite more inflation data showing better-than-expected results.
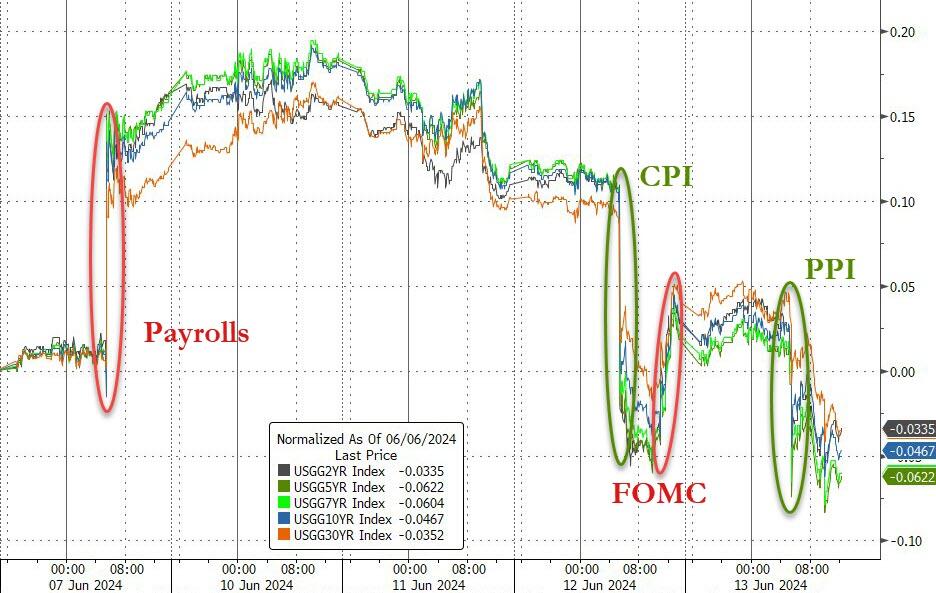
May’s Producer Price Index (PPI), which was anticipated to rise 0.1%, came in lower by 0.2% from the month of April. That sort of confirms the Fed’s view yesterday that “progress has been made on the inflation front.”
Traders are now convinced that the CPI and the PPI have eliminated the always-present possibility of an interest hike, at least for the time being. That should help equities to grind higher and create the summer rally.
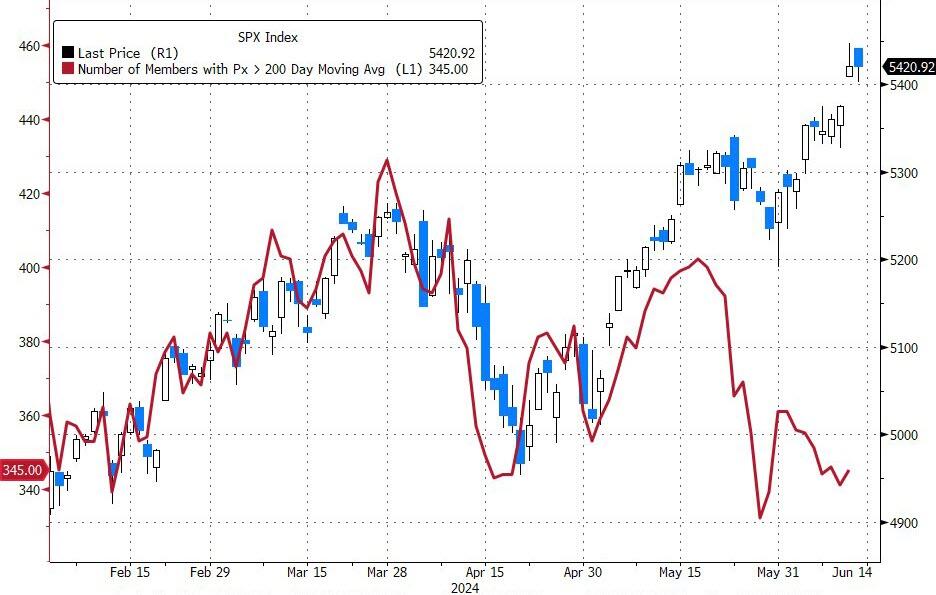
The Dow managed to wipe out most of its early morning losses, while the S&P 500 and Nasdaq knee-jerked and then rebounded to close at new record highs. However, breadth was deplorable and diverged from price action.
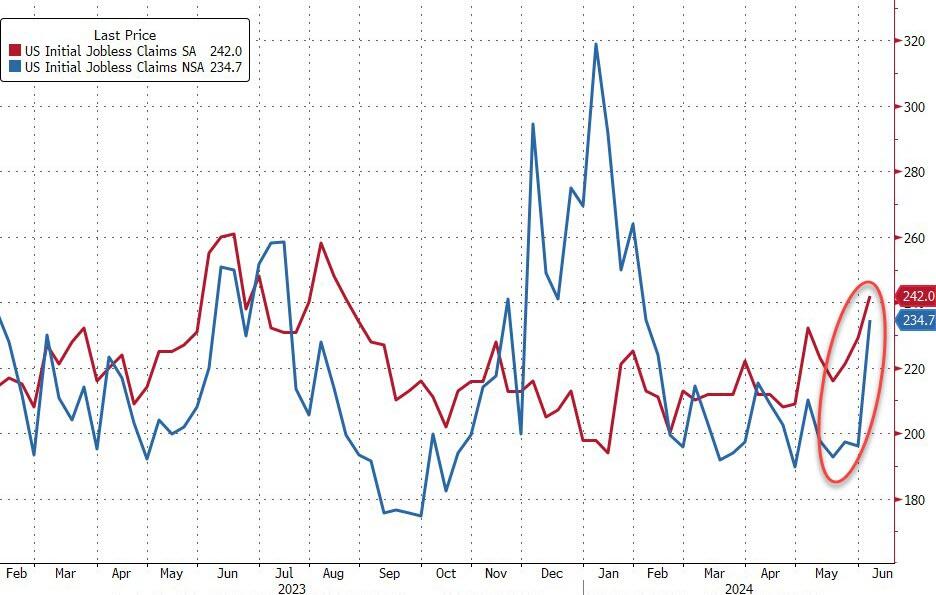
Initial jobless claims surged to 10-month highs, as joblessness soared with California leading the pack. First time applications rose to 242k, much above expectations of 225k and higher from last week’s 229k reading. Continuing claims also headed back above 1.8 million Americans, which was the highest level since January.
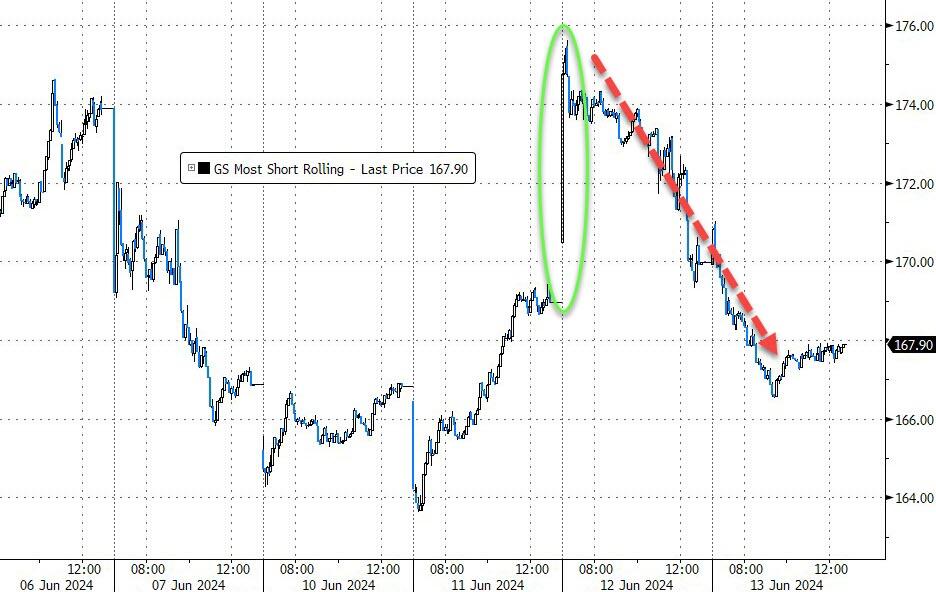
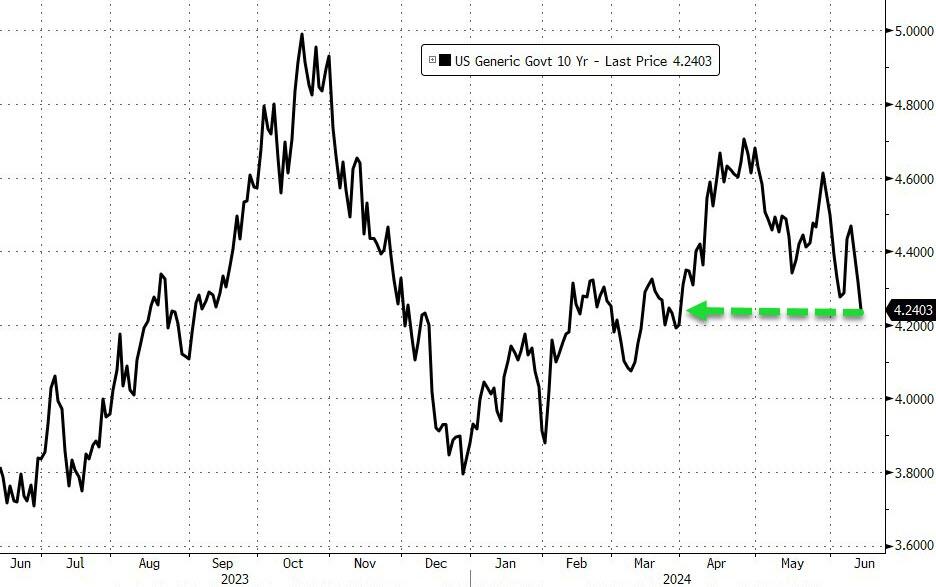
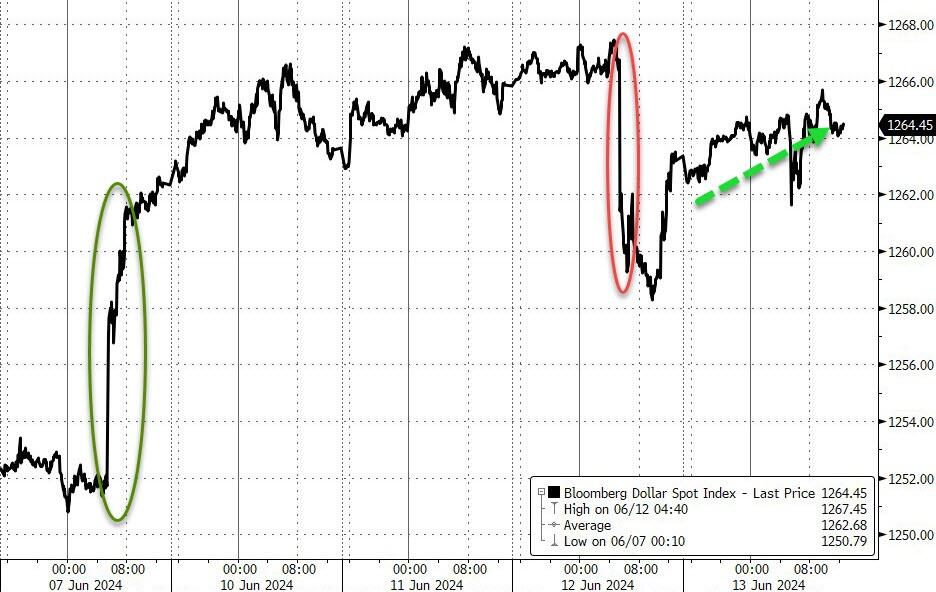
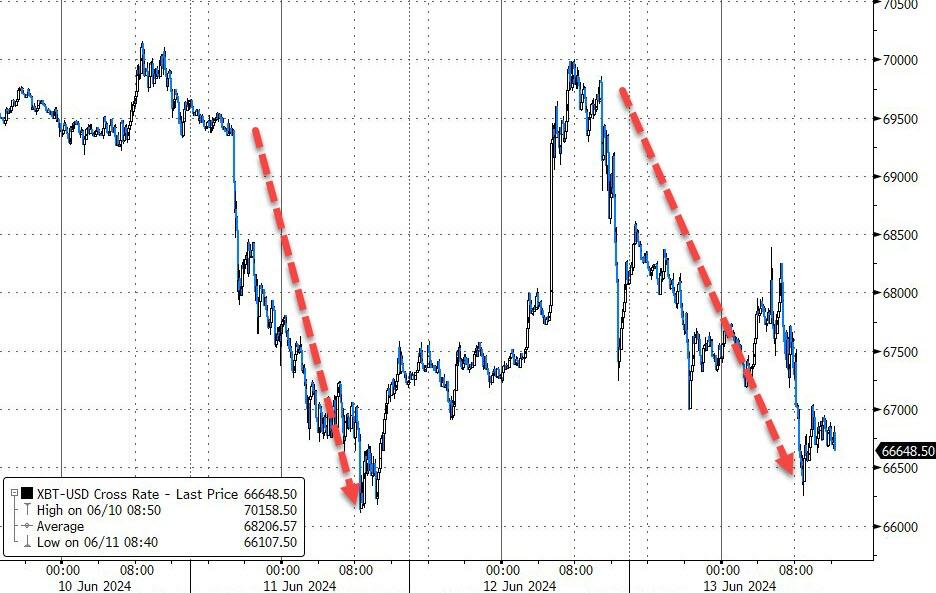
The most shorted stocks continued their decline, bond yields dipped, and the 10-year closed at three-months lows, as ZH pointed out. The dollar edged higher, while Bitcoin retraced yesterday’s gains.
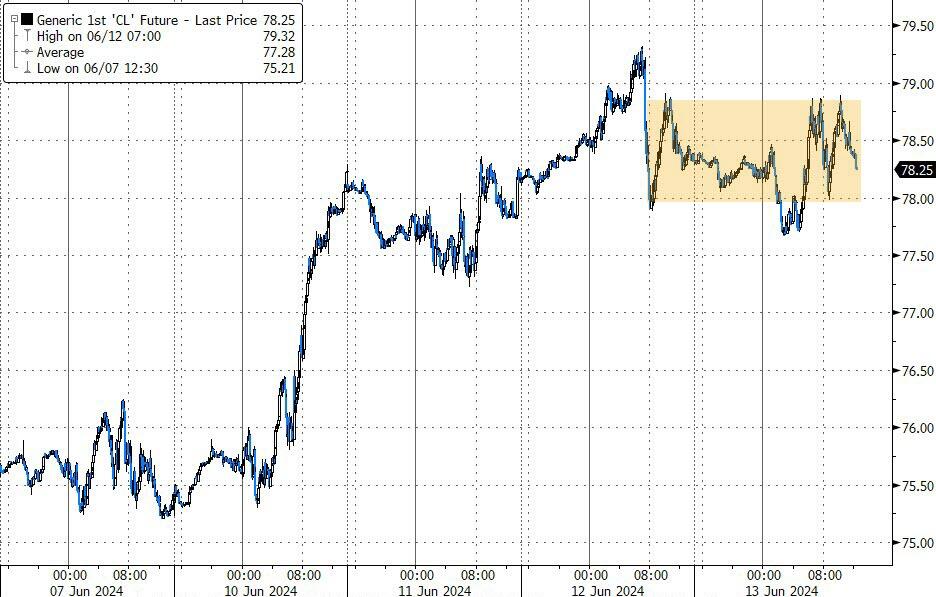
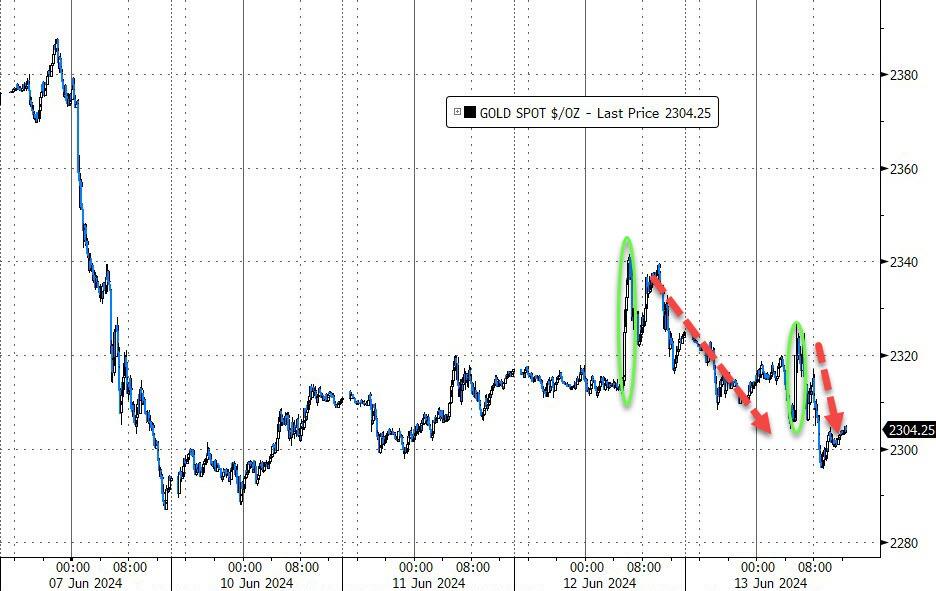
Oil prices zig-zagged but were not able to recapture their $78 level, as gold followed Bitcoins path by giving up yesterday’s advance.
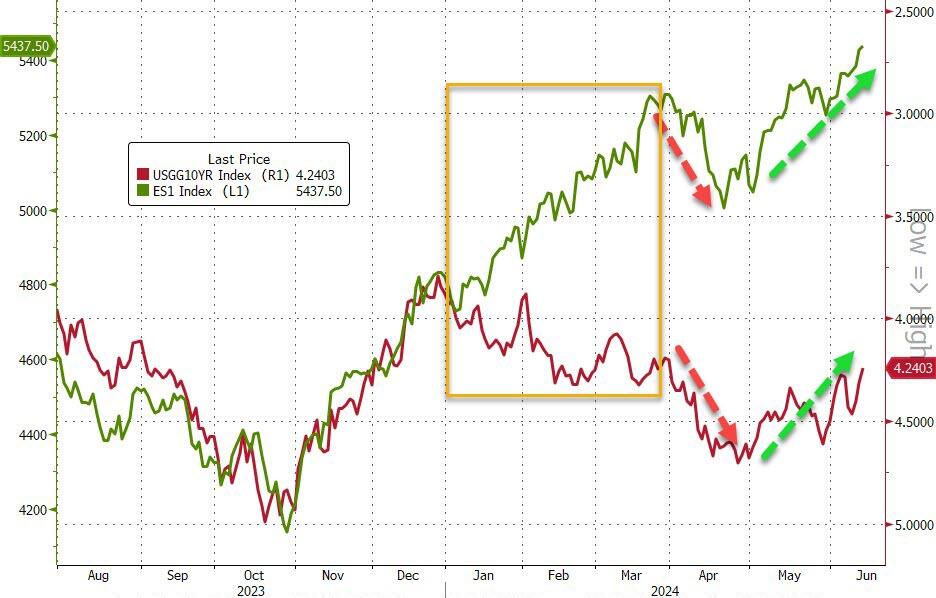
That leaves us with another alligator snout, which prompted ZH to ask:
Which trades first—S&P down to 5,000 or the 10-year yield down to 3.5%?
2. Current “Buy” Cycles (effective 11/21/2023)
Our Trend Tracking Indexes (TTIs) have both crossed their trend lines with enough strength to trigger new “Buy” signals. That means, Tuesday, 11/21/2023, was the official date for these signals.
If you want to follow our strategy, you should first decide how much you want to invest based on your risk tolerance (percentage of allocation). Then, you should check my Thursday StatSheet and Saturday’s “ETFs on the Cutline” report for suitable ETFs to buy.
3. Trend Tracking Indexes (TTIs)
The better-than-expected PPI reading did nothing for the broad market but helped the S&P and Nasdaq to new highs.
Our TTIs diverged and closed moderately lower.
This is how we closed 06/13/2024:
Domestic TTI: +6.32% above its M/A (prior close +6.62%)—Buy signal effective 11/21/2023.
International TTI: +6.92% above its M/A (prior close +7.56%)—Buy signal effective 11/21/2023.
All linked charts above are courtesy of Bloomberg via ZeroHedge.
———————————————————-
WOULD YOU LIKE TO HAVE YOUR INVESTMENTS PROFESSIONALLY MANAGED?
Do you have the time to follow our investment plans yourself? If you are a busy professional who would like to have his portfolio managed using our methodology, please contact me directly to get more details.
Contact Ulli