
ETF Tracker StatSheet
You can view the latest version here.
STRONG JOBS REPORT SHAKES RATE CUT DREAMS, BOND YIELDS LEAP
- Moving the markets
Traders’ dreams for an interest rate cut were dashed this morning, as the jobs report came in stronger than expected. Nonfarm payrolls allegedly increased by 272k last month, considerably above expectations of 190k and April’s 175k. Oddly enough, the unemployment rate increased to 4%.
Wall Street had been wishing for weak numbers in anticipation that the Fed might step in and loosen up its interest rate policy. This stronger performance will likely limit them in following the footsteps of the Bank of Canada and ECB, unless other pertinent data point to more widespread economic difficulty.
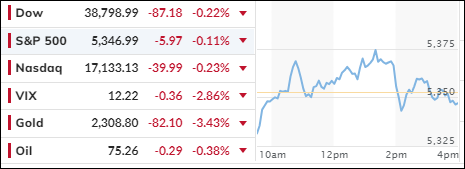
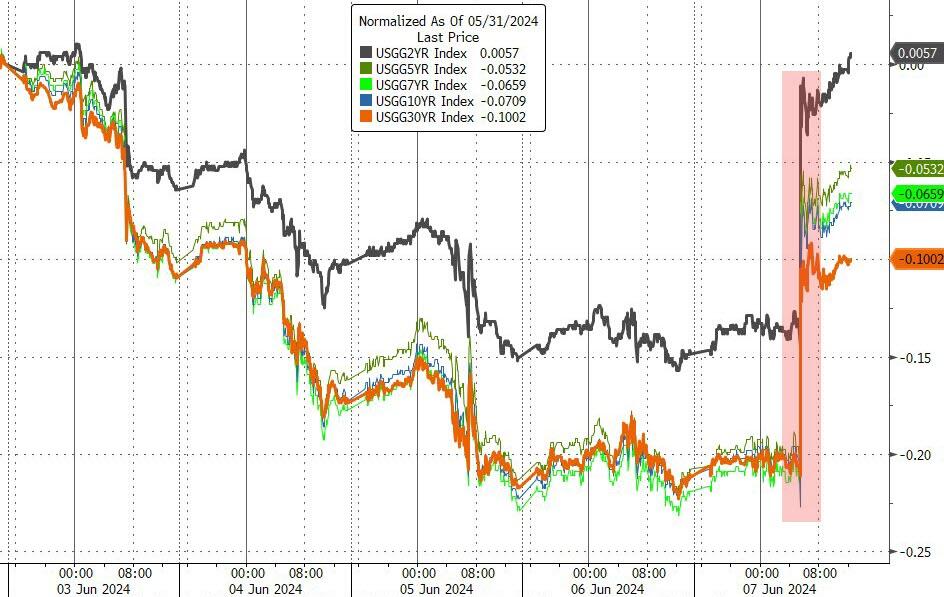
Bond yields surged on the news with the 10-year up some 14 basis points to 4.44%. Despite the disappointment, bullish sentiment prevailed with the major indexes recapturing their unchanged lines, vacillating around them but then dumping into the close.
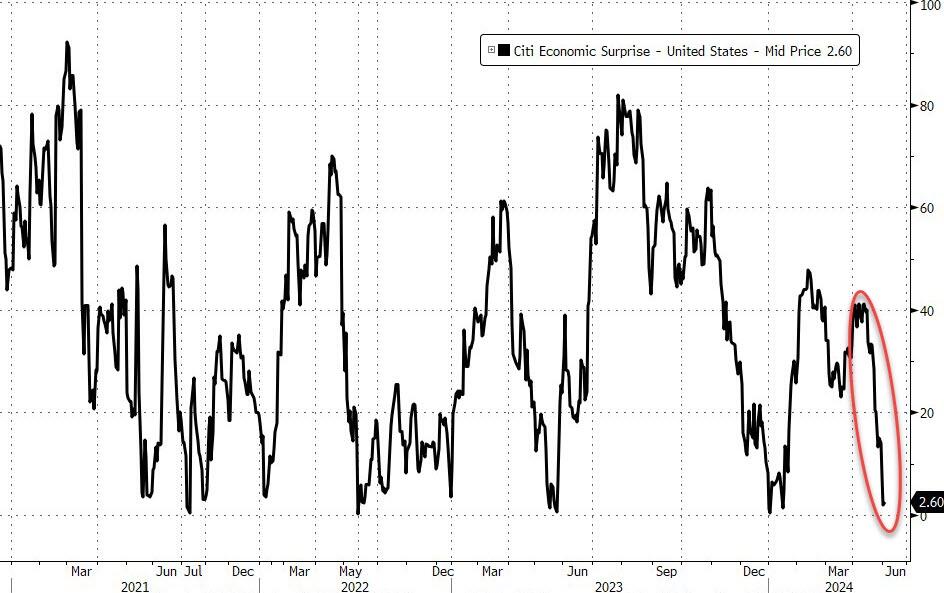
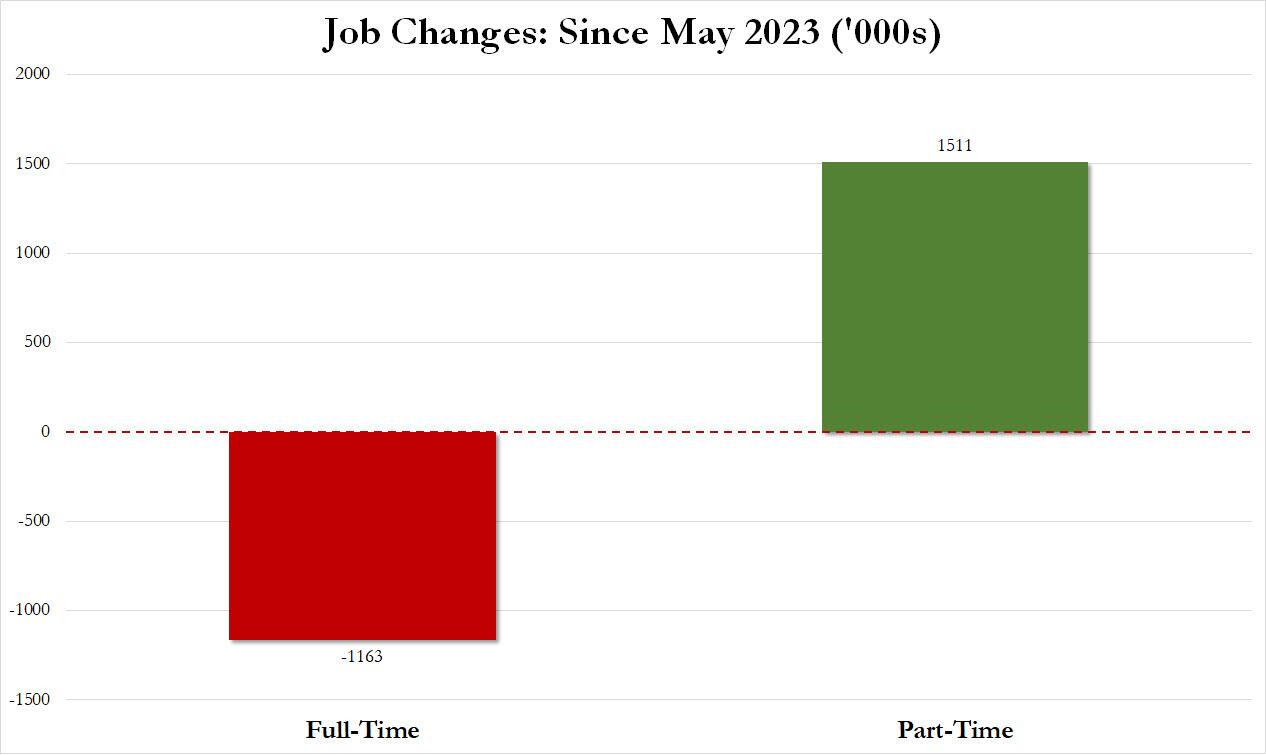
Overall, weaker than expected economic data pulled the Citi Economic Surprise index lower, making today’s payrolls report an outlier and questionable. Looking under the hood, it turned out, as ZH reported, that in the past year 1.2 million full-time jobs have been lost and replaced by 1.5 million part-time jobs.
As far as the month of May 2024 is concerned, 625k full-time jobs were lost in one month, replaced by 286k part-time. And, as I reported yesterday, the change in employment since December 2019 looks like this.
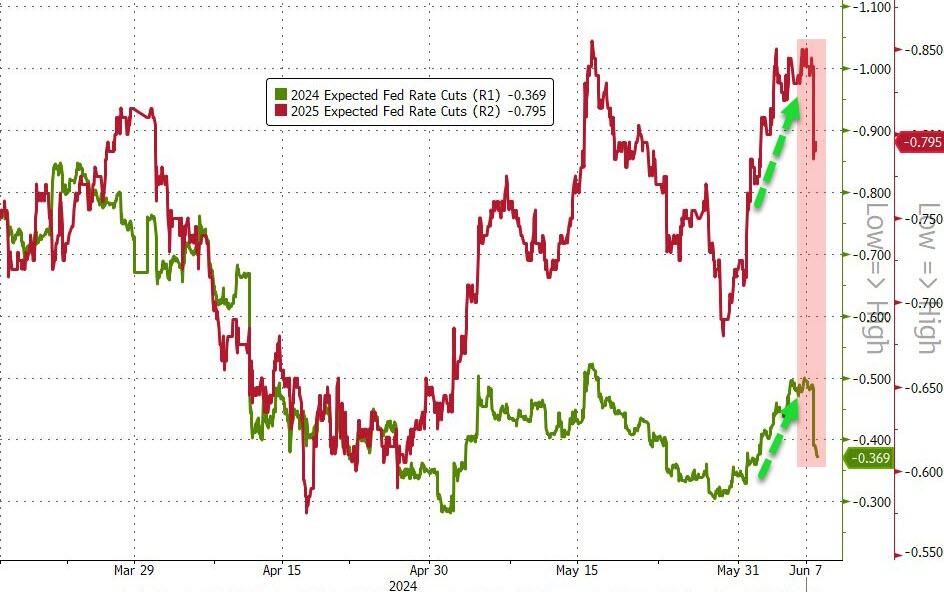
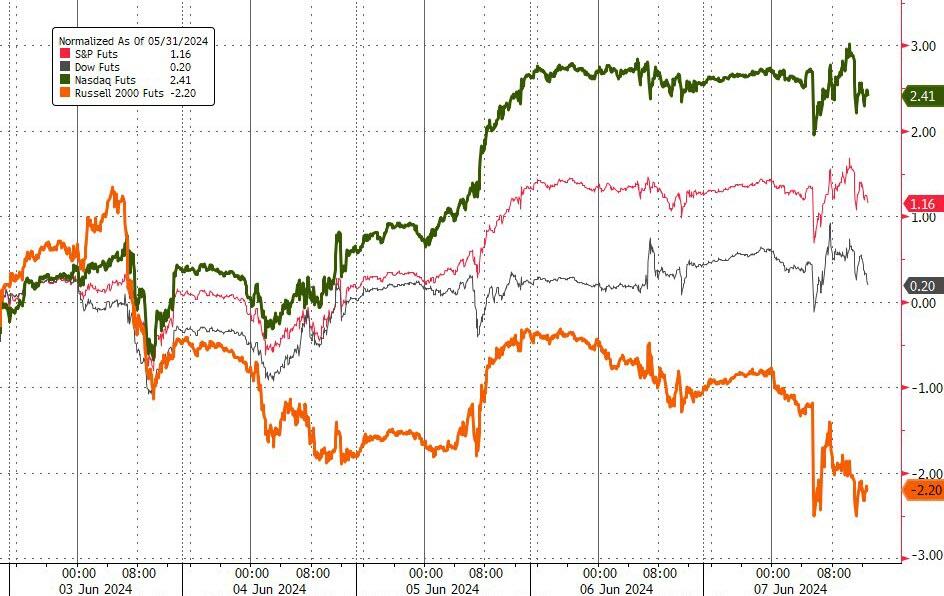
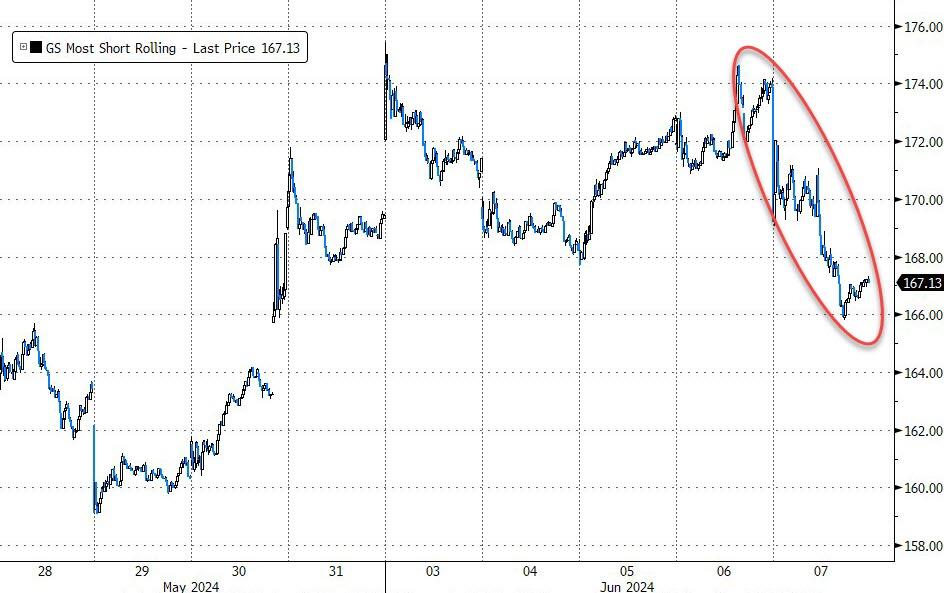
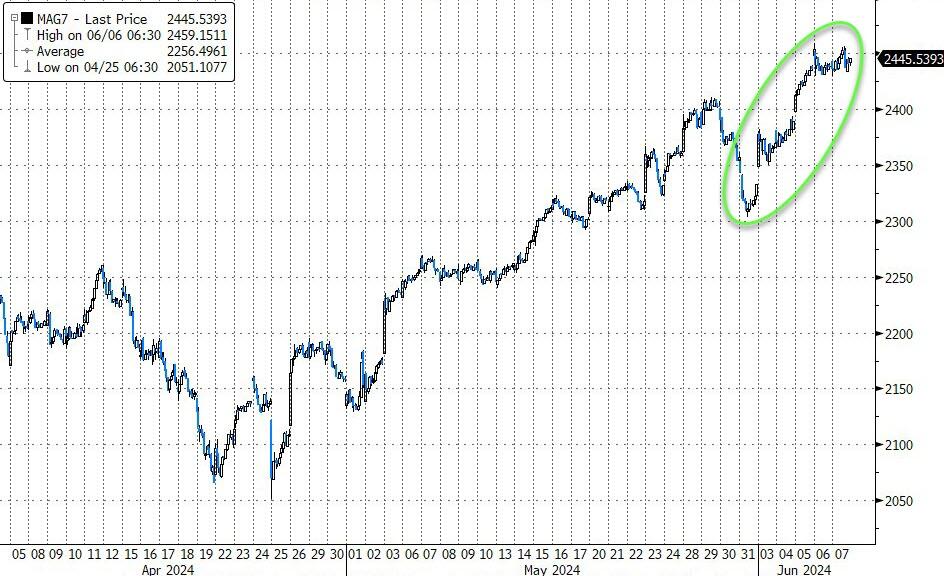
Rate cut expectations dropped, the Nasdaq outperformed for the week, as Small Caps were punished and the most shorted stocks retreated. However, the MAG7 group rallied for the 6th week out of 7.
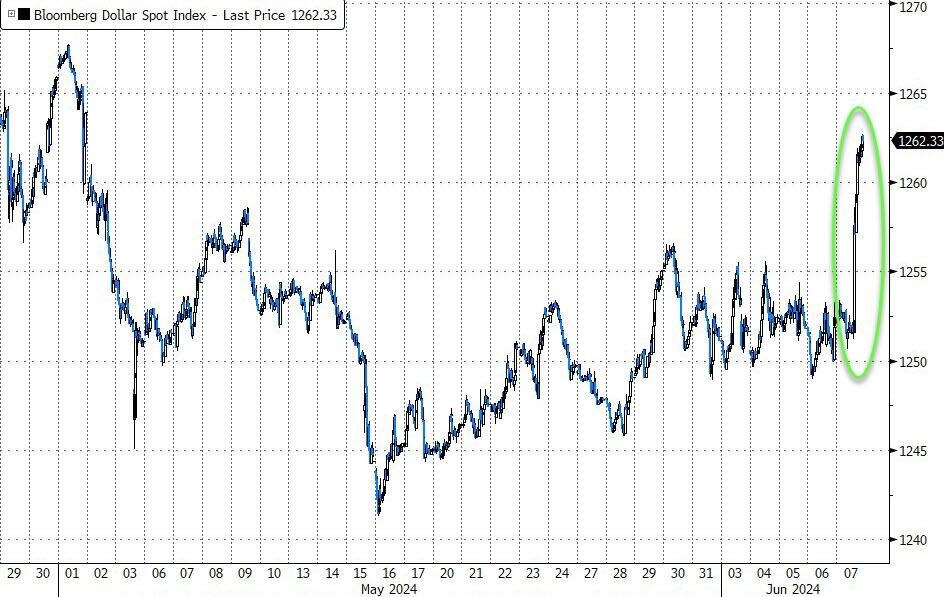
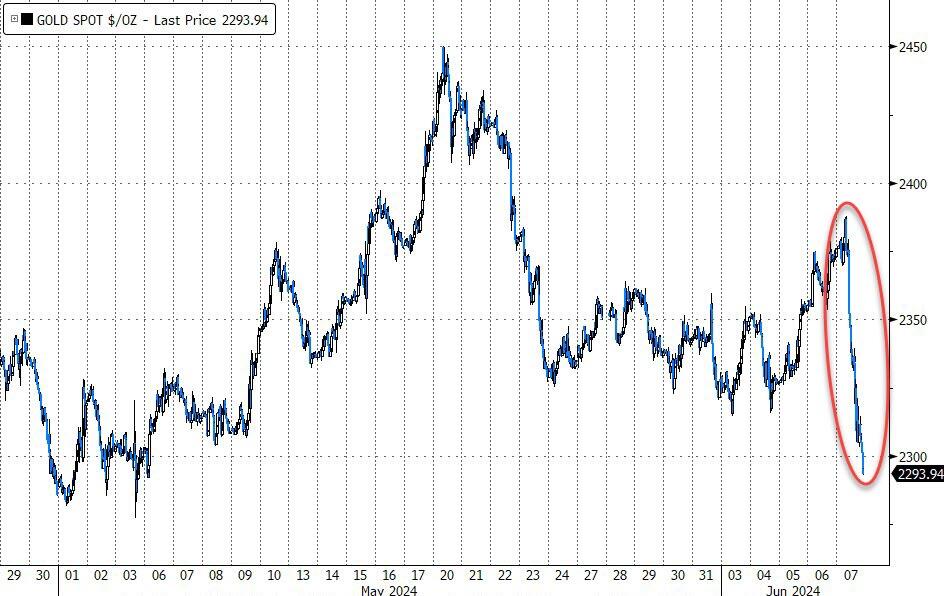
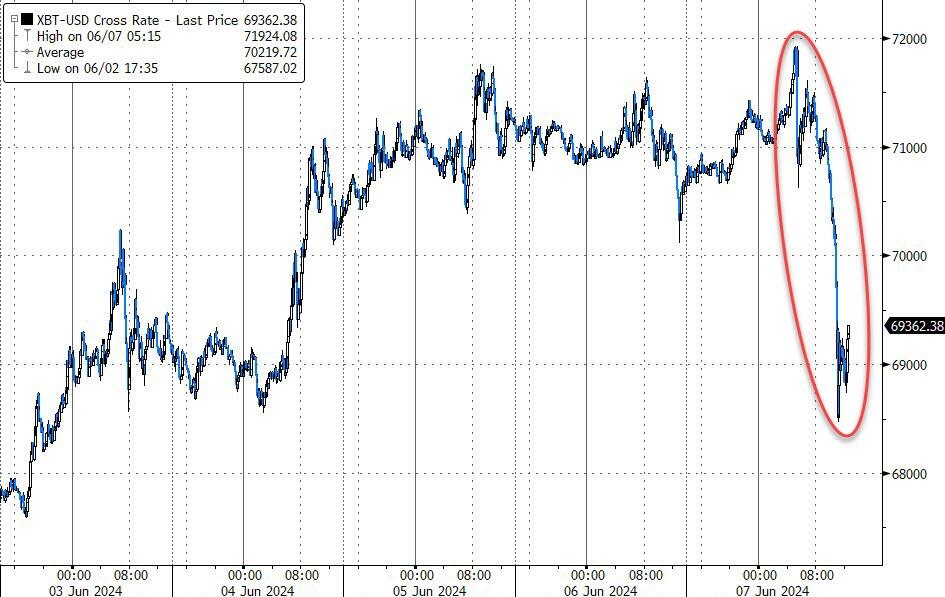
Bond yields, after slipping for 4 days, spiked today, which propelled the dollar higher, but pulled the rug out from under gold, which headed back down to its early May lows. Bitcoin followed suit and surrendered its gains from the last few days.
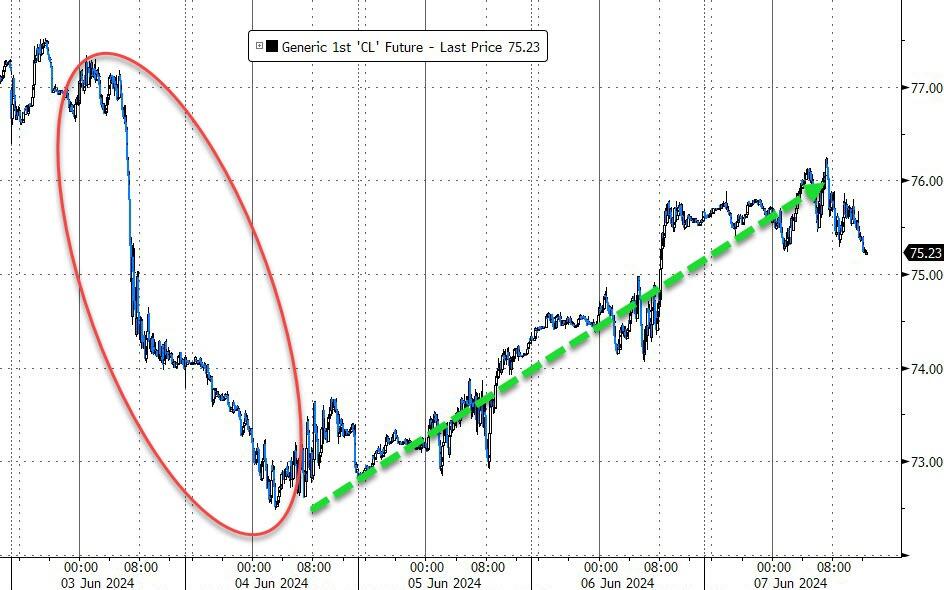
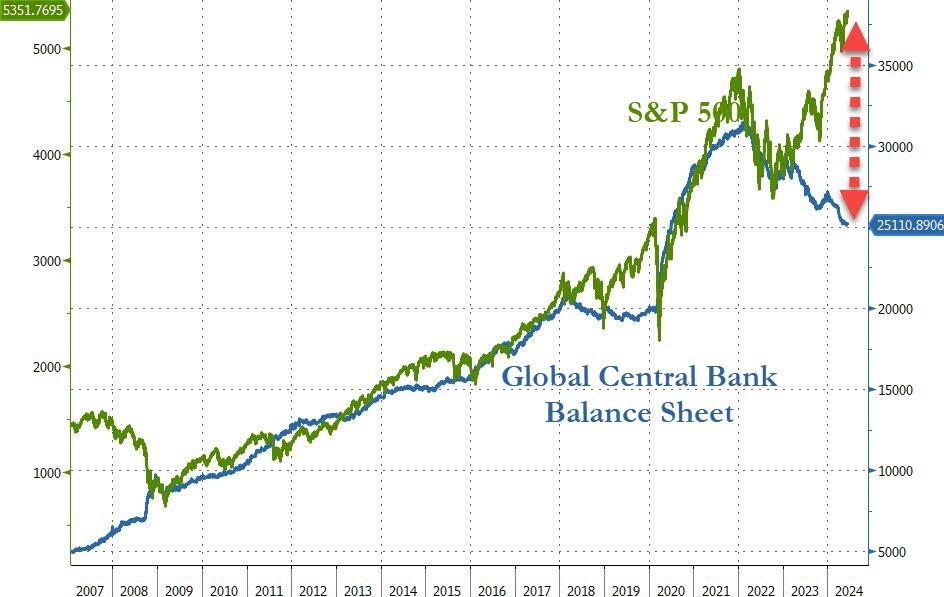
Crude oil prices recovered from Monday’s dump, but global liquidity seems to have disappeared and created an untenable situation, as this chart demonstrates.
Hmm, who will end up being the loser?
2. Current “Buy” Cycles (effective 11/21/2023)
Our Trend Tracking Indexes (TTIs) have both crossed their trend lines with enough strength to trigger new “Buy” signals. That means, Tuesday, 11/21/2023, was the official date for these signals.
If you want to follow our strategy, you should first decide how much you want to invest based on your risk tolerance (percentage of allocation). Then, you should check my Thursday StatSheet and Saturday’s “ETFs on the Cutline” report for suitable ETFs to buy.
3. Trend Tracking Indexes (TTIs)
A strong jobs report killed bullish sentiment and gave the bears a reason to cheer, as the major indexes closed the session in the red but advanced for the week.
Our TTIs gave back a portion of their recent gains.
This is how we closed 06/07/2024:
Domestic TTI: +6.21% above its M/A (prior close +6.88%)—Buy signal effective 11/21/2023.
International TTI: +8.34% above its M/A (prior close +9.29%)—Buy signal effective 11/21/2023.
All linked charts above are courtesy of Bloomberg via ZeroHedge.
———————————————————-
WOULD YOU LIKE TO HAVE YOUR INVESTMENTS PROFESSIONALLY MANAGED?
Do you have the time to follow our investment plans yourself? If you are a busy professional who would like to have his portfolio managed using our methodology, please contact me directly to get more details.
Contact Ulli