
ETF Tracker StatSheet
You can view the latest version here.
H1 2024: A TALE OF RALLIES AND DISLOCATIONS – IS THE MARKET DANCING ON THIN ICE?
- Moving the markets
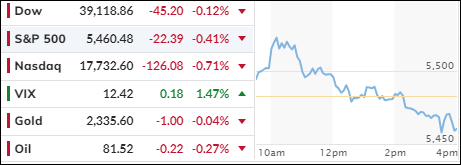
The major indexes started the session on a positive note, as traders were pleased with the latest release of the Personal Consumptions Expenditure index. The PCE showed that inflation has slowed, and consumer sentiment was better than expected.
Core PCE, which excludes food and energy prices, rose only 0.1% last month and 2.6% from the prior year, in line with expectations. The headline number, including food and energy, was flat on the month and YoY (up 2.6%), according to MarketWatch.
Consumer sentiment for June rose to 68.2 from a preliminary 65.6 reading. The one-year inflation outlook unexpectedly fell from 3.3% to 3%. All the above prompted the Wall Street bulls to push the buy buttons—and off to the races we went, until it all fell apart.
Early enthusiasm waned, and the major indexes closed this session in the red but posted solid gains for the month and quarter.
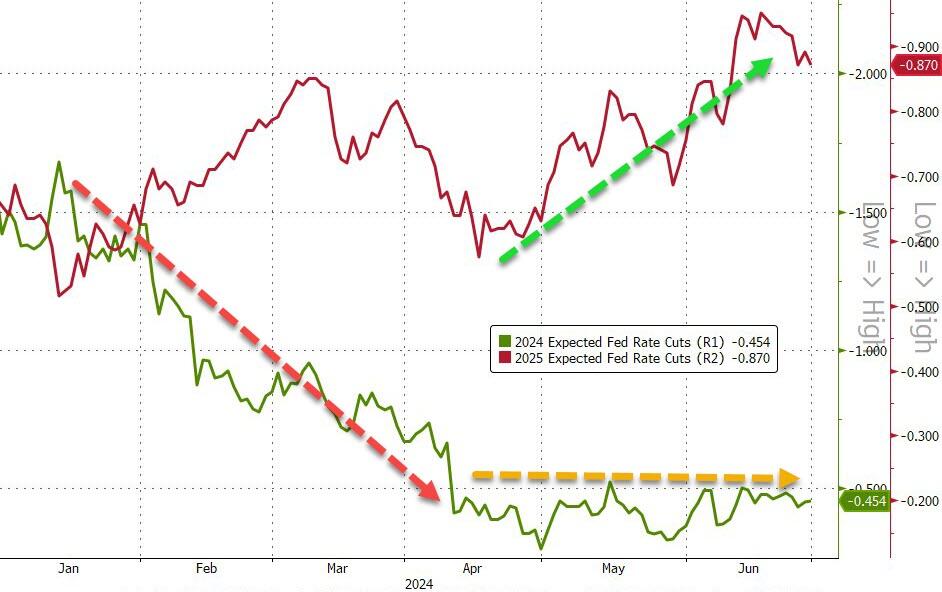
Traders immediately assumed that a rate cut will be a possibility, and they are betting that the odds are 59.5% of the Fed lowering rates in September.
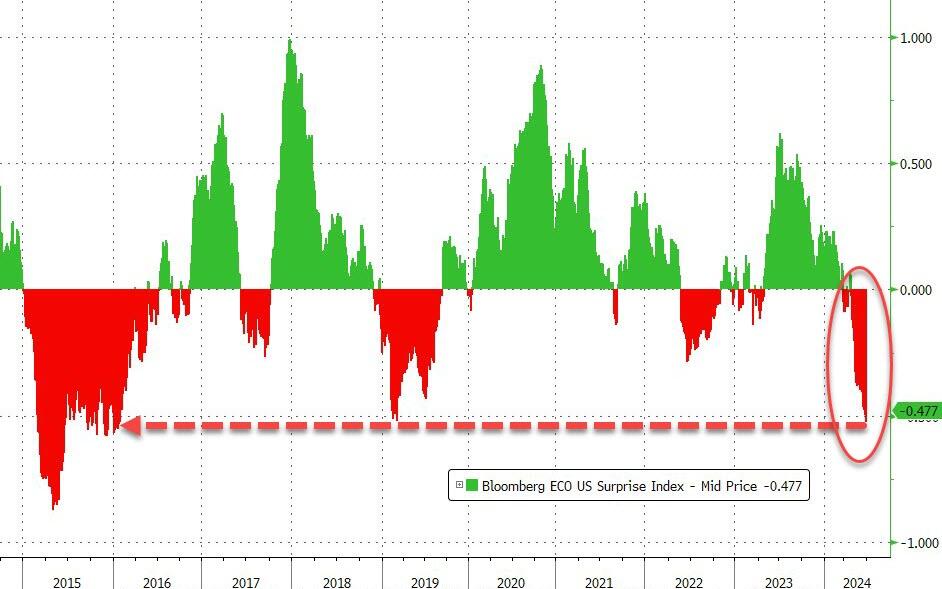
US Macro data disappointed in the first half of 2024 and crashed to its lowest point since 2016. Oddly enough, rate-cut expectations plunged YTD. Go figure…
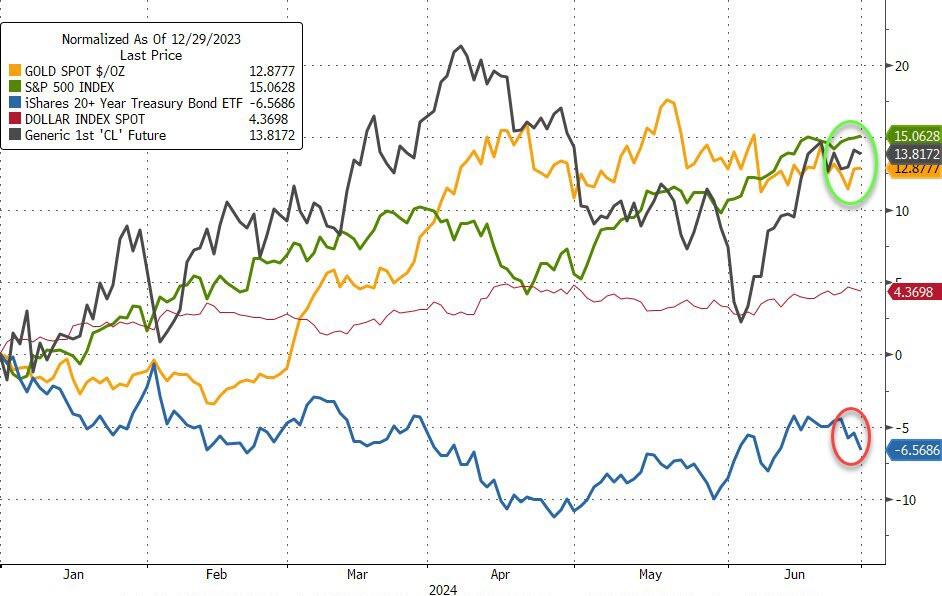
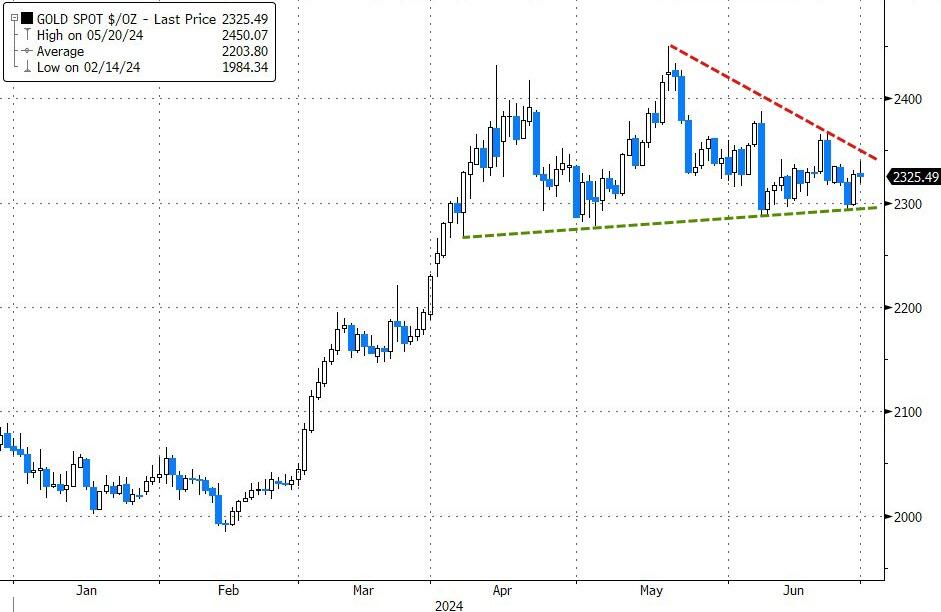
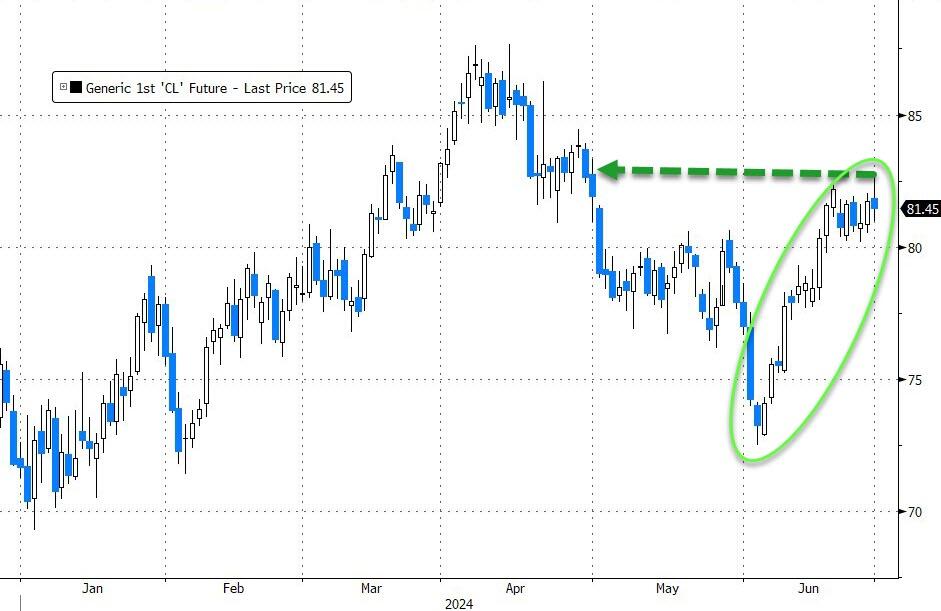
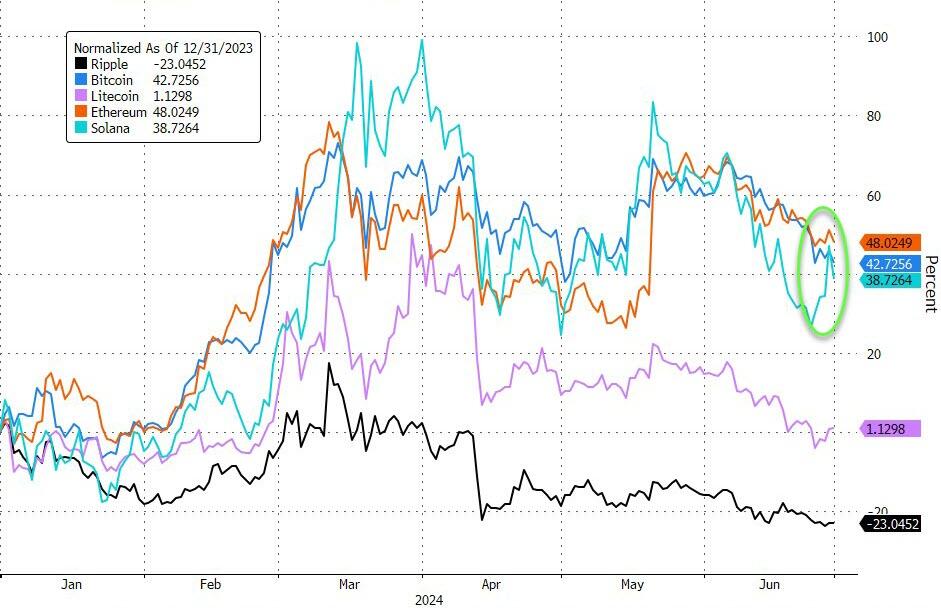
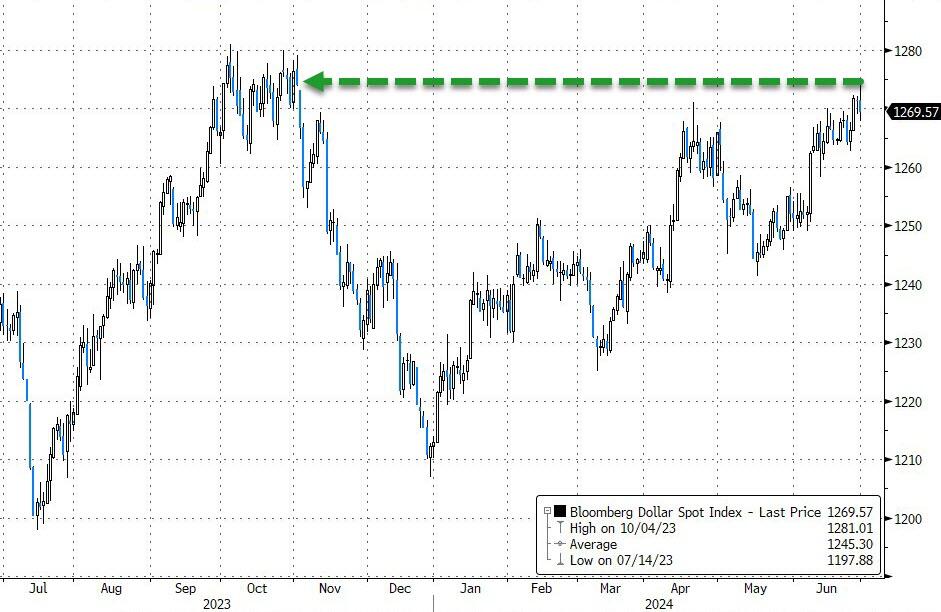
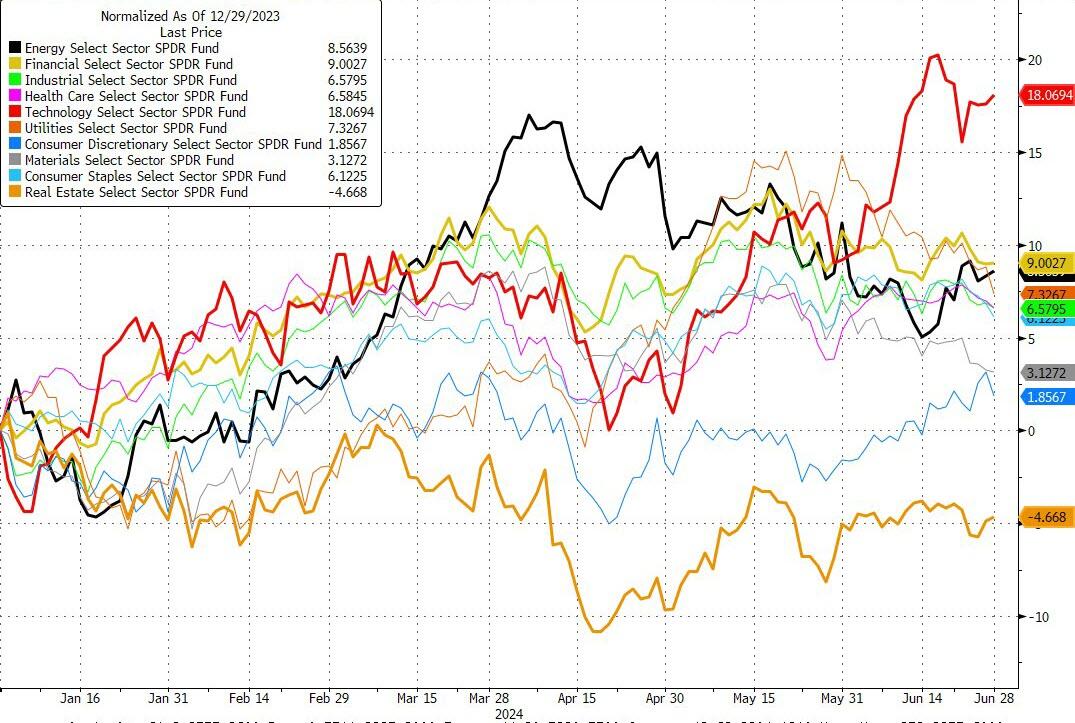
The first half of the year sported rallies in stocks, gold (+13%), crude oil and Bitcoin, which ended H1 up 40%. Bonds lost, but the dollar showed some strength. Mega-cap tech supported the S&P 500 and the Nasdaq, but the broad market did not participate.
While traders are almost giddy about this year’s performance, caution is warranted as severe dislocations are lurking.
How about the S&P 500’s relentless climb vs. a deteriorating global balance sheet?
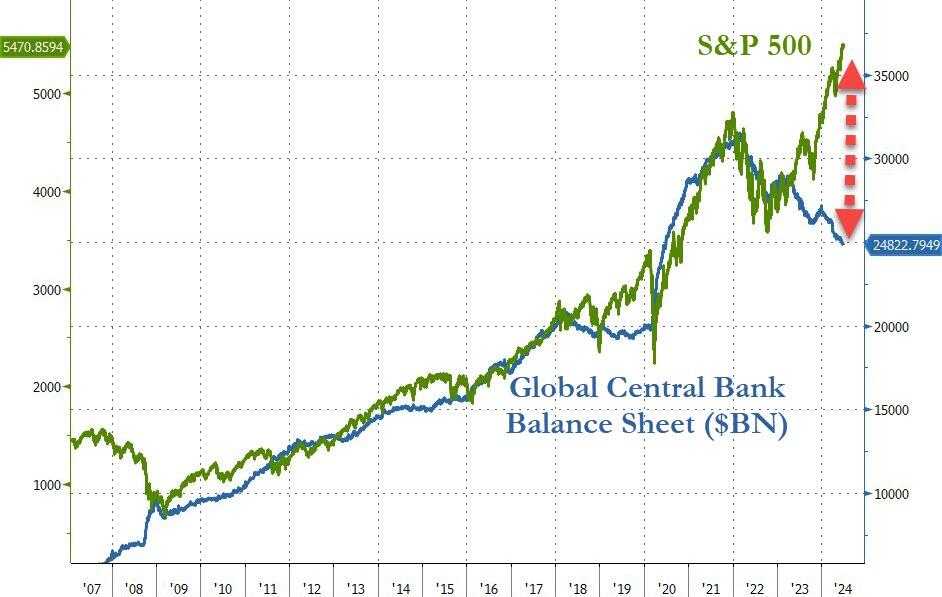
If history is any indication, this will not go on forever, which poses this question: Do you have an exit strategy?
2. Current “Buy” Cycles (effective 11/21/2023)
Our Trend Tracking Indexes (TTIs) have both crossed their trend lines with enough strength to trigger new “Buy” signals. That means, Tuesday, 11/21/2023, was the official date for these signals.
If you want to follow our strategy, you should first decide how much you want to invest based on your risk tolerance (percentage of allocation). Then, you should check my Thursday StatSheet and Saturday’s “ETFs on the Cutline” report for suitable ETFs to buy.
3. Trend Tracking Indexes (TTIs)
An early rally ran into a brick wall, reversed, and forced the major indexes to a red close.
Our TTIs ended the session mixed, with the Domestic one advancing and the International one declining.
This is how we closed 06/28/2024:
Domestic TTI: +5.30% above its M/A (prior close +5.22%)—Buy signal effective 11/21/2023.
International TTI: +6.22% above its M/A (prior close +6.65%)—Buy signal effective 11/21/2023.
All linked charts above are courtesy of Bloomberg via ZeroHedge.
———————————————————-
WOULD YOU LIKE TO HAVE YOUR INVESTMENTS PROFESSIONALLY MANAGED?
Do you have the time to follow our investment plans yourself? If you are a busy professional who would like to have his portfolio managed using our methodology, please contact me directly to get more details.
Contact Ulli