
ETF Tracker StatSheet
You can view the latest version here.
TRIPLE WITCHING LEAVES MARKETS UNSHAKEN, BUT ECONOMIC INDICATORS SUGGEST CAUTION AHEAD
- Moving the markets
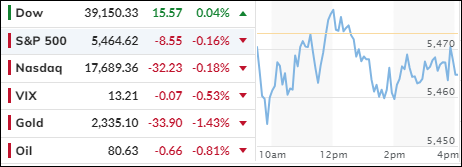
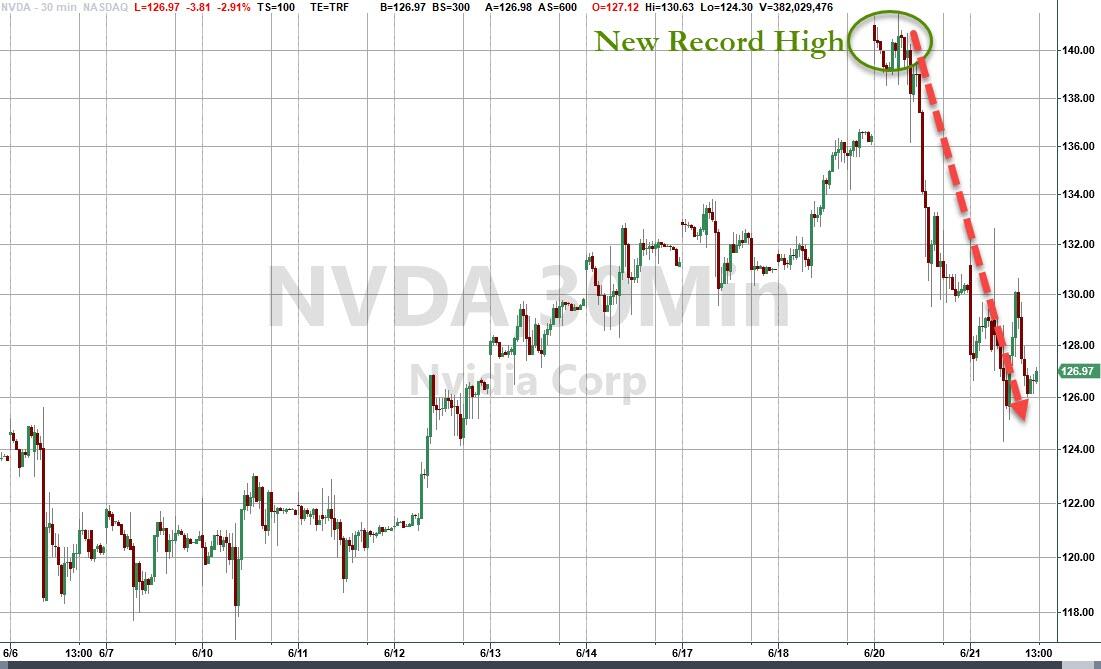
The major indexes wavered around their unchanged lines, as this monster of an options expiration session got underway. Nvidia slipped over 3% but given its 150% gain YTD, that move is insignificant.
For sure, we have seen some signs of market exuberance or overextension, but it’s too early to judge whether there is more room for the AI fueled rally on the upside. However, we know that this relentless rise will not go on forever.
That does not mean a crash is imminent, we could very well see the narrowly based advance broaden and include the “neglected” sectors that have been lagging. In other words, some kind of rebalancing may contribute to positive sentiment and be the next driver to keep this market alive.
Again, trading volatility was likely be an outlier due to triple witching, the expiration of stock options, stock index options and stock index futures options. Surprisingly, the major indexes traded in a tight trading range with not much lost and not much gained.
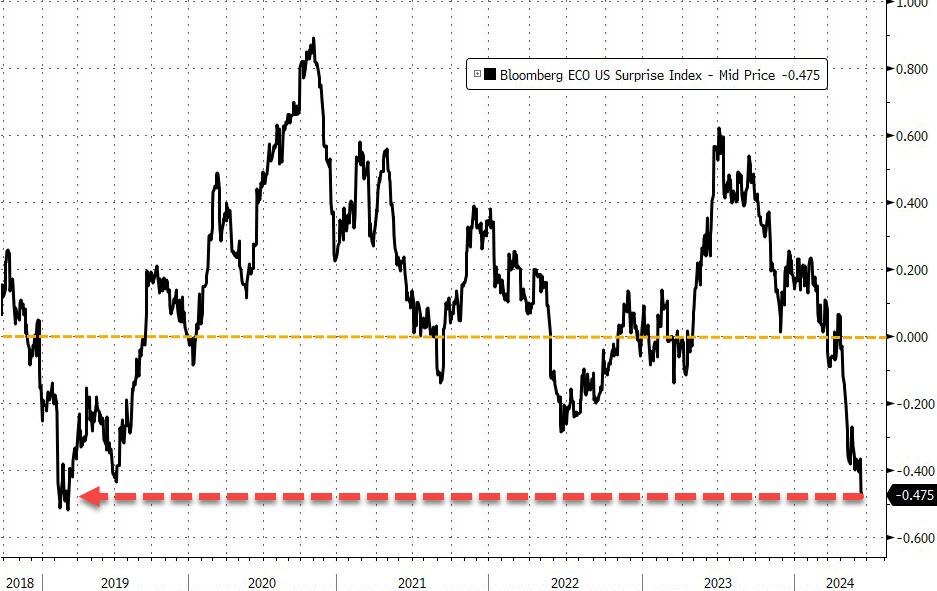
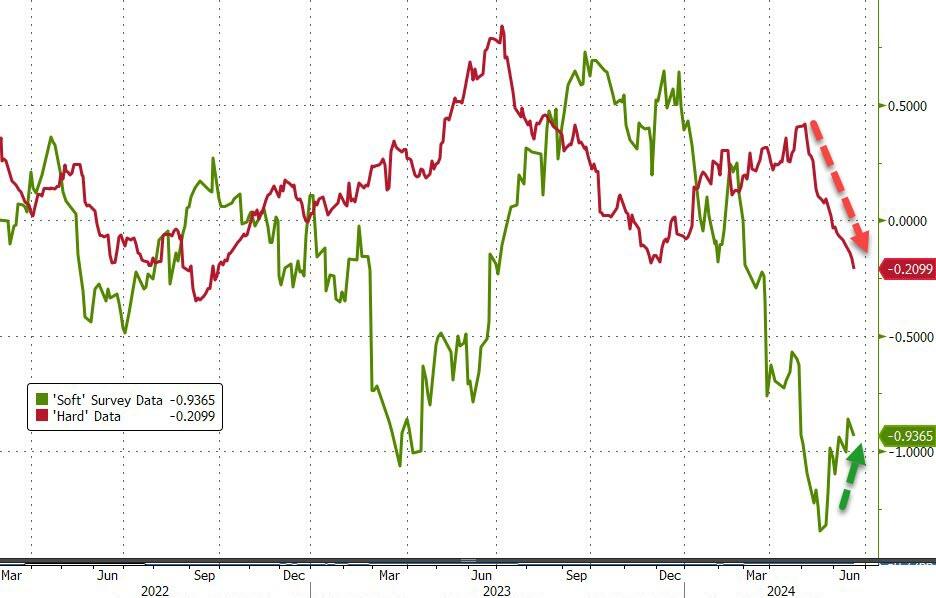
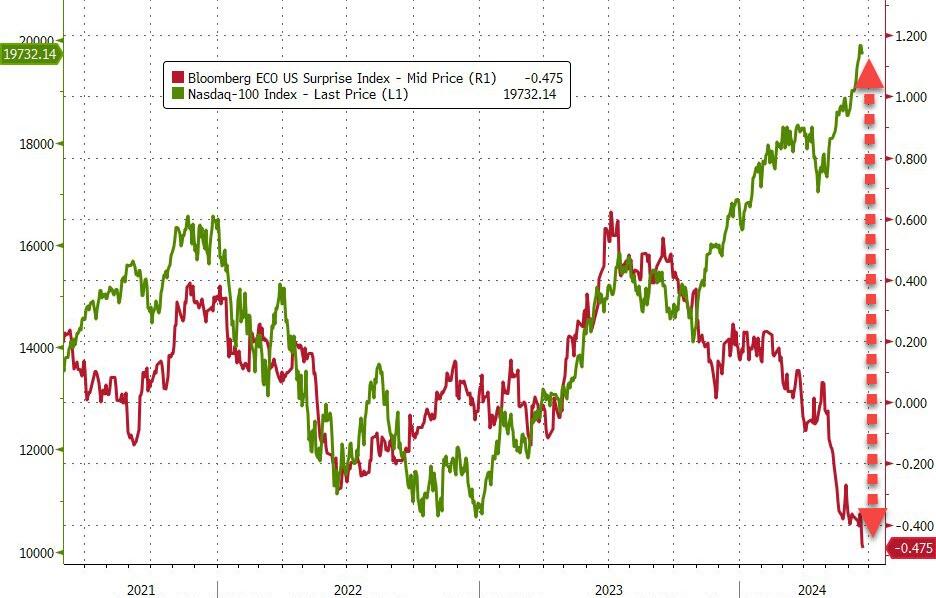
In terms of economic data points, this week was unpleasant, as the Economic Surprise Index tanked, mainly due to “hard” data scoring its worst decline since September 2022, while “soft” data improved off nine-year lows, as ZH pointed out.
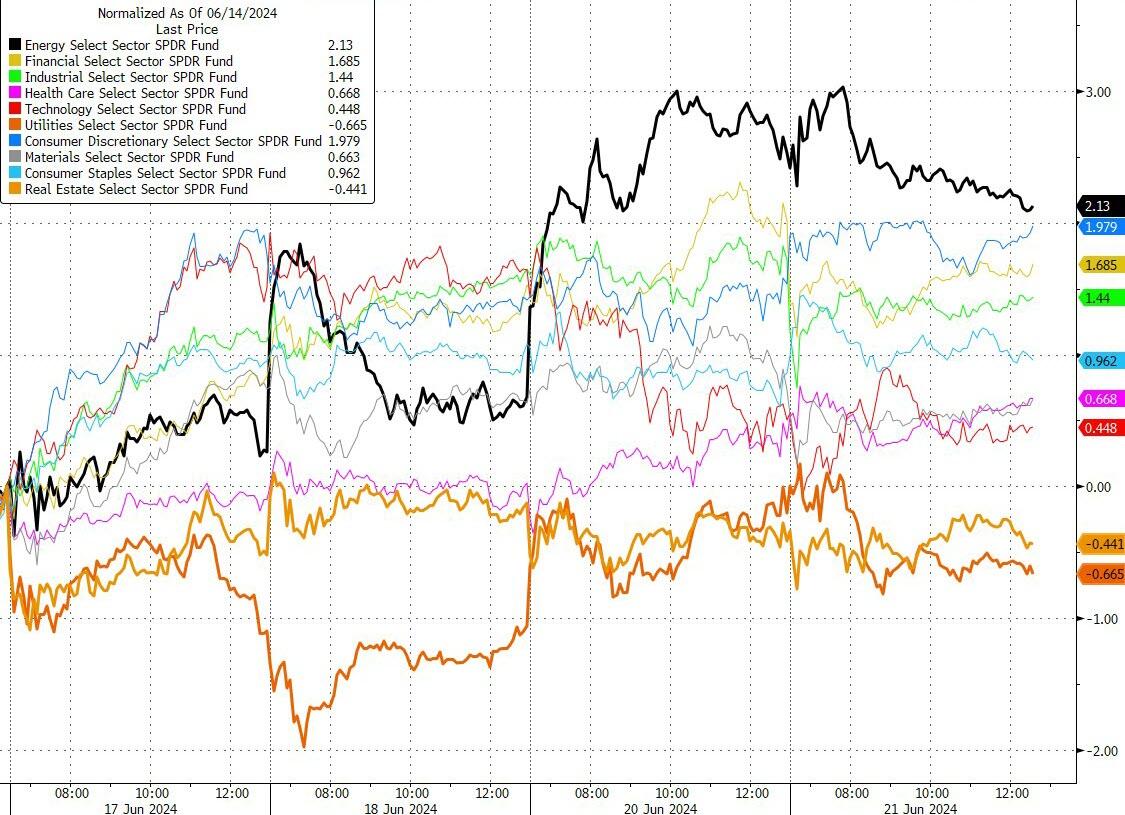
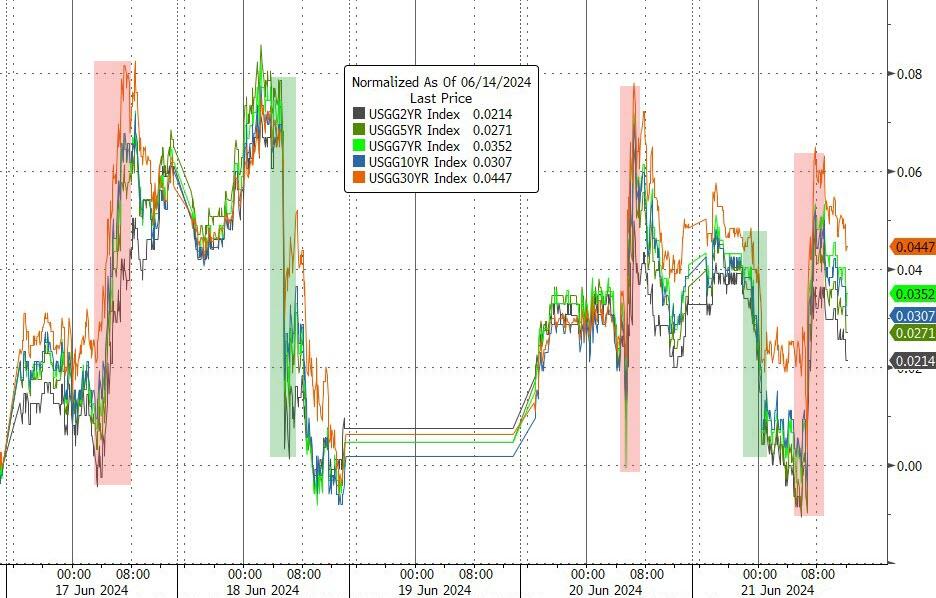
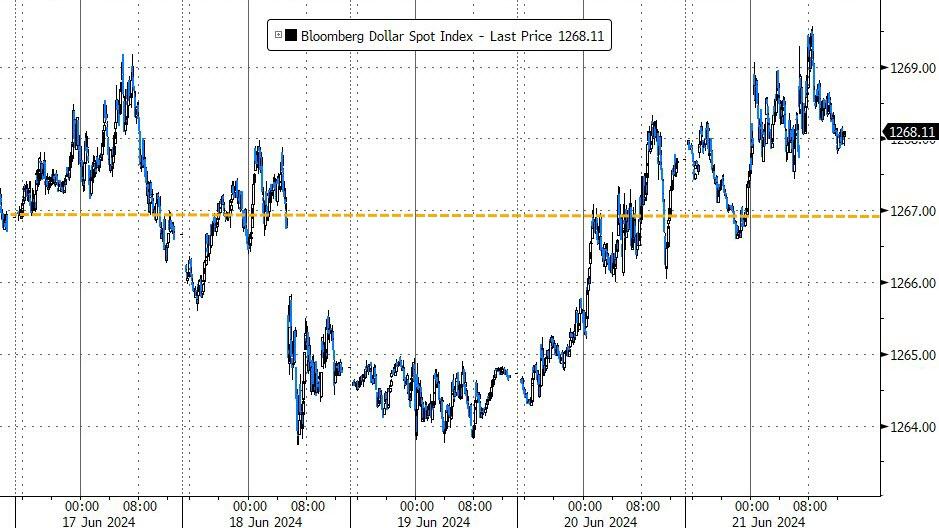
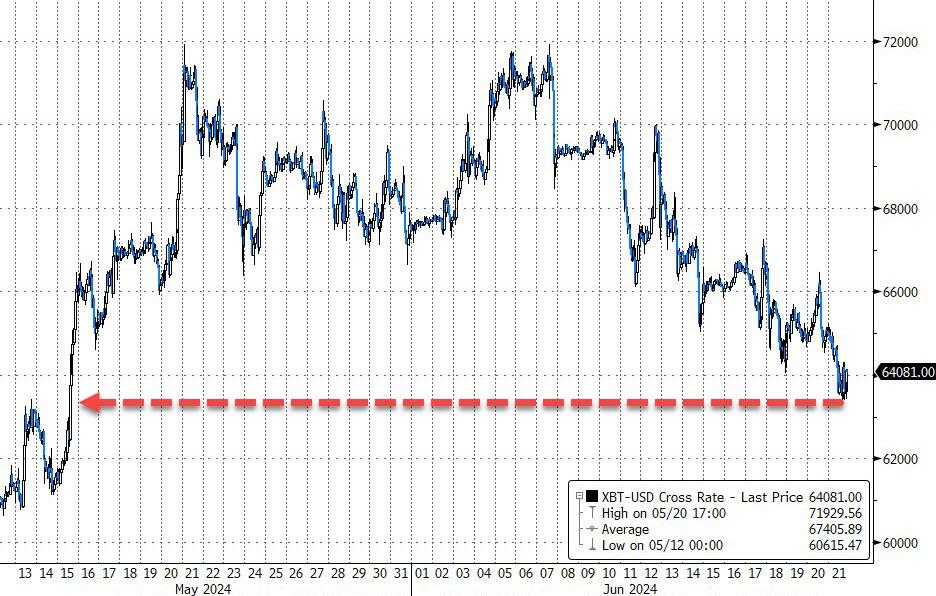
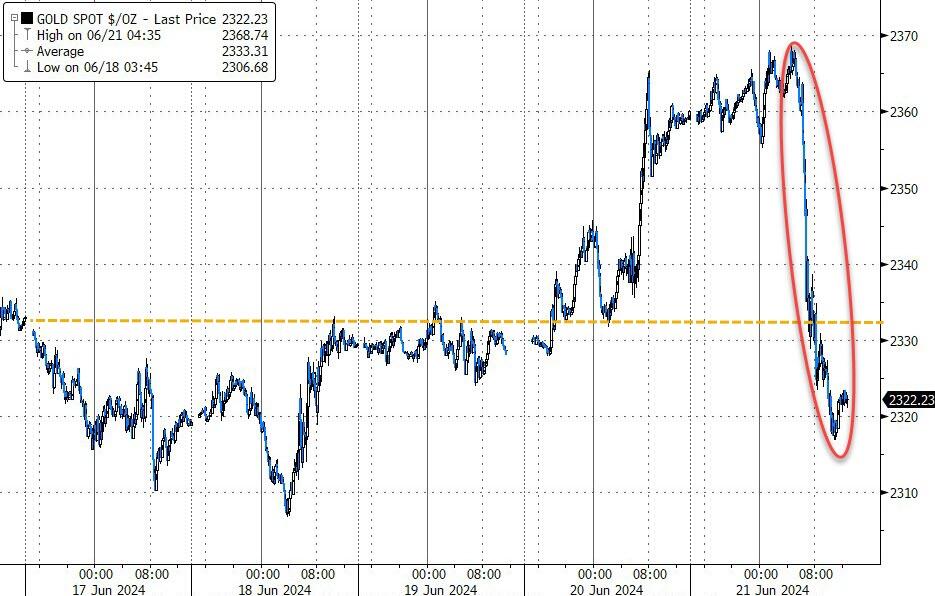
Energy outperformed this week, Nvidia suffered its first down-week in two months, while bond yields inched up slightly. The dollar gained a tad, Bitcoin lost some mojo, gold was up but got sold sharply this morning therefore ending the week in the red.
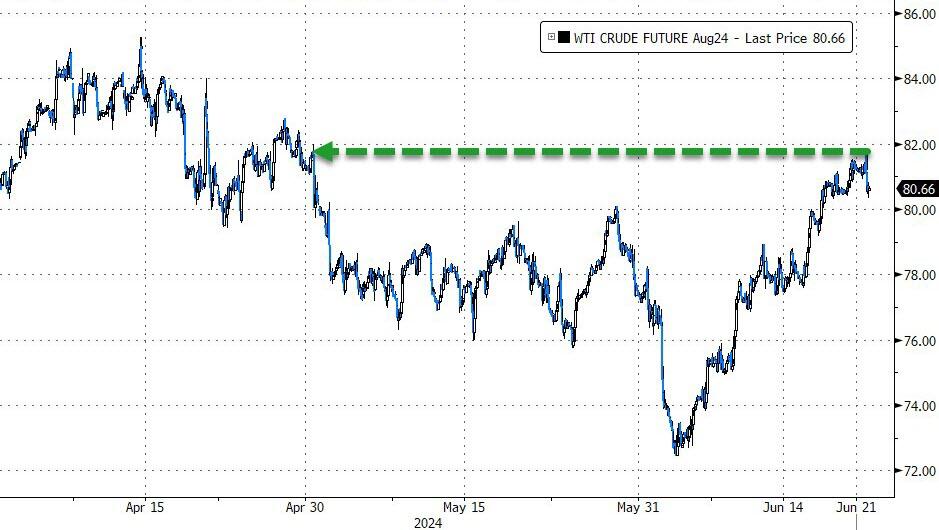
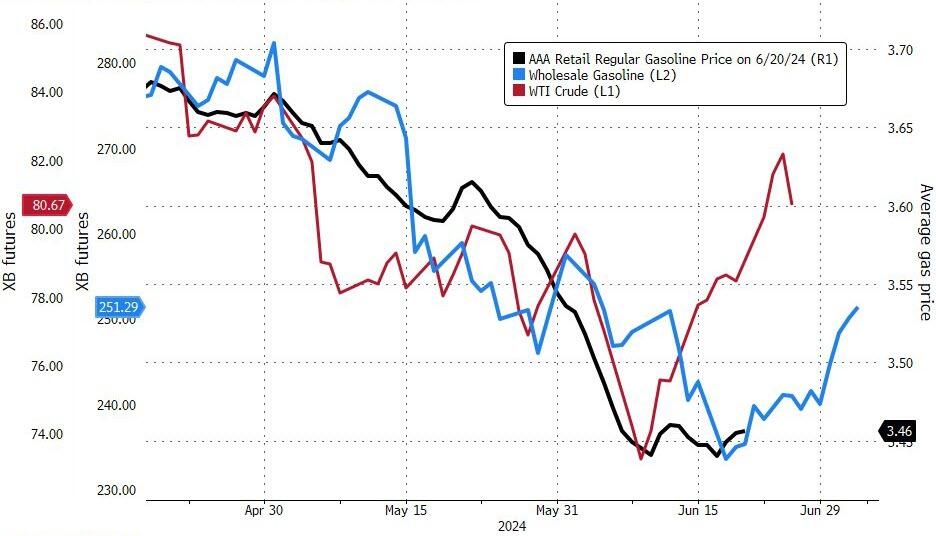
Crude oil rallied to its highest since April despite taking dip in today’s the session. That will have an effect on pump prices in the near future.
With the Economic Surprise index tanking, you would think that stock prices would be negatively influenced, but you would be wrong. The divergence is as wide as ever, which makes me ponder what it will take to revert back to reality.
2. Current “Buy” Cycles (effective 11/21/2023)
Our Trend Tracking Indexes (TTIs) have both crossed their trend lines with enough strength to trigger new “Buy” signals. That means, Tuesday, 11/21/2023, was the official date for these signals.
If you want to follow our strategy, you should first decide how much you want to invest based on your risk tolerance (percentage of allocation). Then, you should check my Thursday StatSheet and Saturday’s “ETFs on the Cutline” report for suitable ETFs to buy.
3. Trend Tracking Indexes (TTIs)
Volatility was higher during this triple witching options expiration session. However, the major indexes traded in a tight range and closed not far off from the prior day.
Our TTIs pulled back a tad, which did not affect our current positive outlook.
This is how we closed 06/21/2024:
Domestic TTI: +6.14% above its M/A (prior close +6.42%)—Buy signal effective 11/21/2023.
International TTI: +6.47% above its M/A (prior close +7.35%)—Buy signal effective 11/21/2023.
All linked charts above are courtesy of Bloomberg via ZeroHedge.
———————————————————-
WOULD YOU LIKE TO HAVE YOUR INVESTMENTS PROFESSIONALLY MANAGED?
Do you have the time to follow our investment plans yourself? If you are a busy professional who would like to have his portfolio managed using our methodology, please contact me directly to get more details.
Contact Ulli