
- Moving the markets
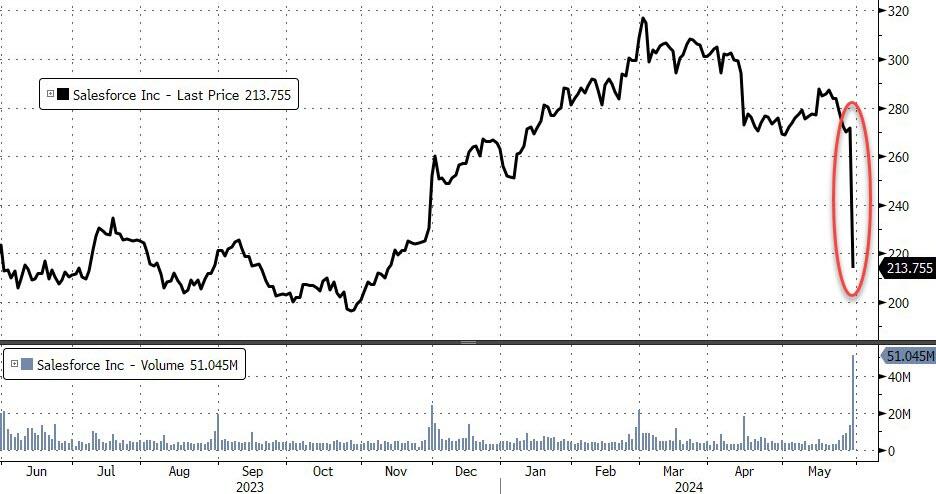
The major indexes started this session deep in the red, with Salesforce’s 20% drop due to a revenue miss and weak guidance setting a bearish background, while upcoming key inflation data created anxiety on the trading floors.
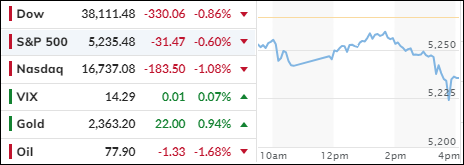
Despite this being a holiday shortened week, the major indexes are modestly in the red and seem to be on track to snap their five-week winning streaks. The Dow fared the worst by having lost more than 2% so far.
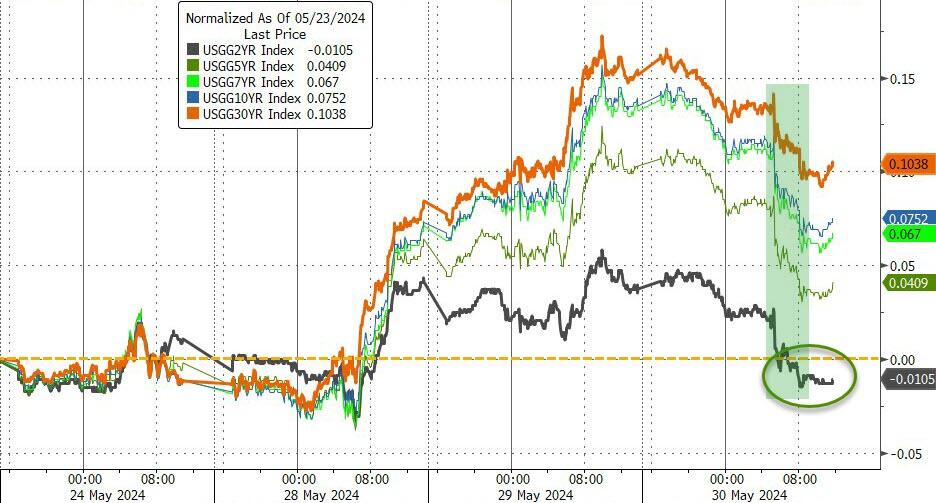
Higher bond yields affected bullish sentiment negatively, as safer investments with higher yields provided a risk-off alternative to equities. The line in the sand has been the 4.5% yield for the 10-year, and we are currently above that level.
Despite this rollercoaster week, the major indexes look to close out the month of May with solid gains, with the Nasdaq and S&P so far being in the green by 7% and 4% respectively.
Still, I see more choppiness ahead, as concerns about consumer health are on traders’ minds along with the path of interest rates, both of which will have a direct impact on market direction.
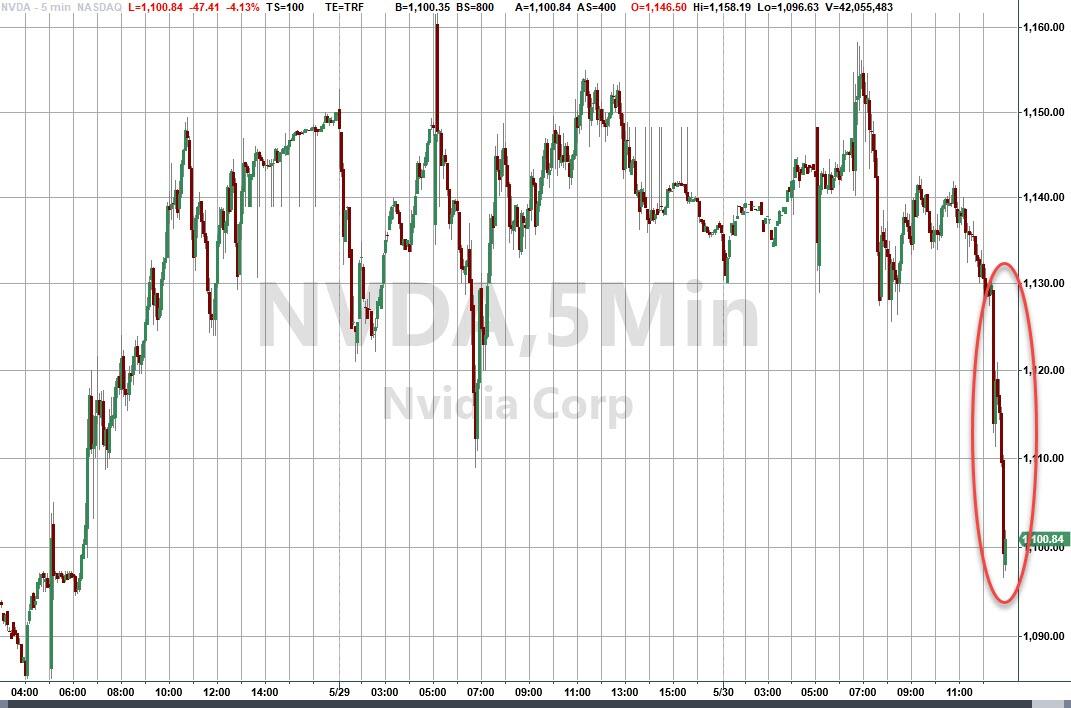
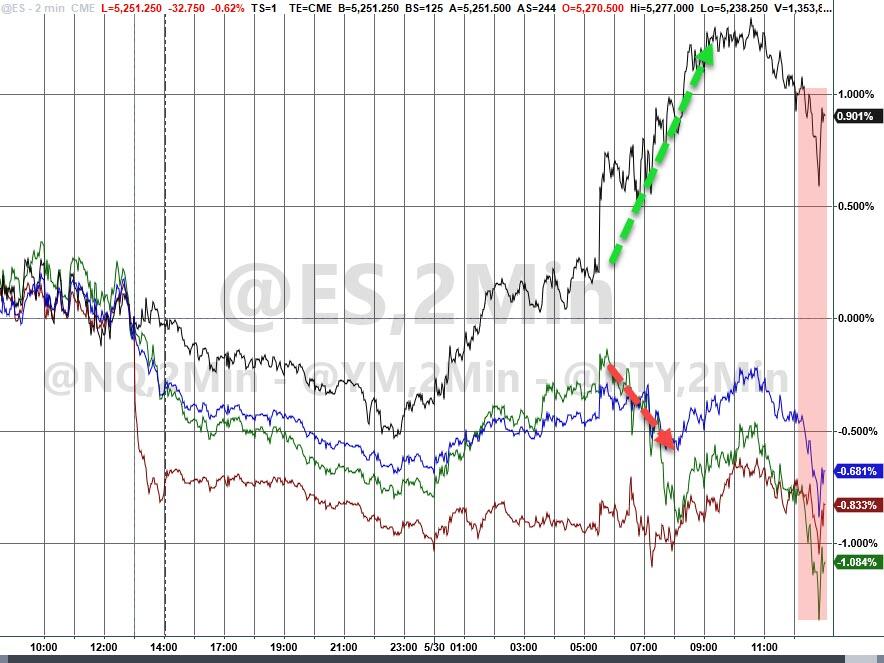
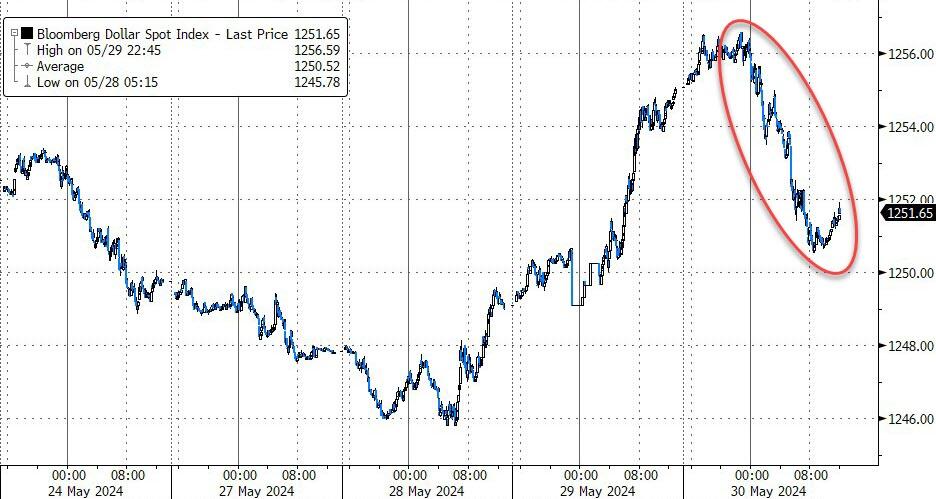
Bond yields slipped, but that did not assist Nvidia, as the tech giant pulled back almost 4%. Small Caps saved the day for equities by rallying around 1%, while the dollar dropped and erased yesterday’s gains.
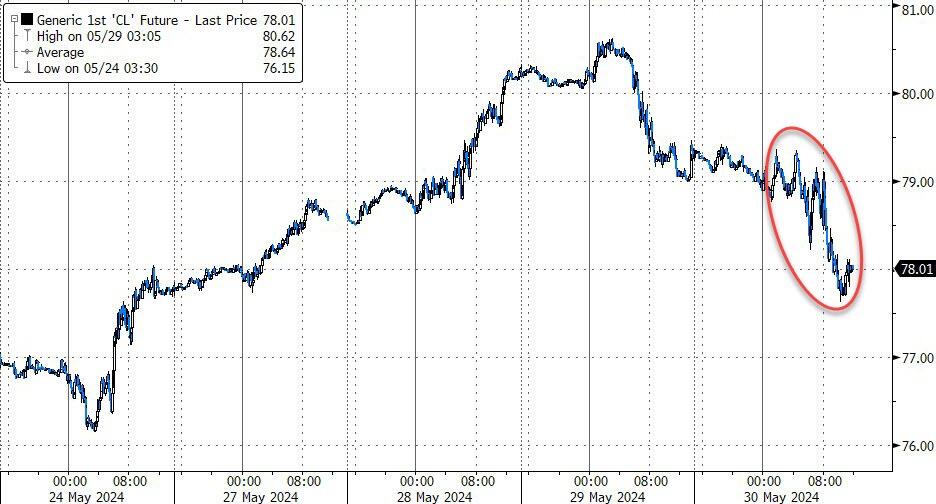
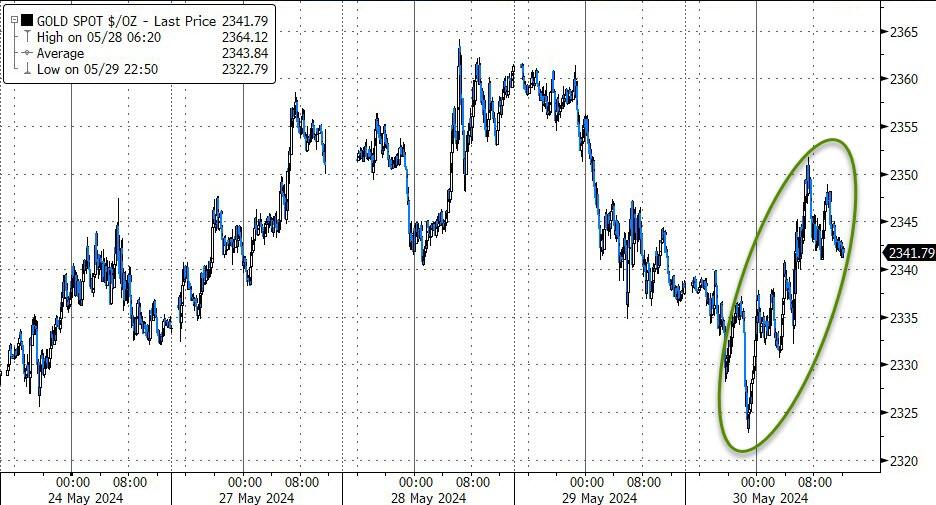
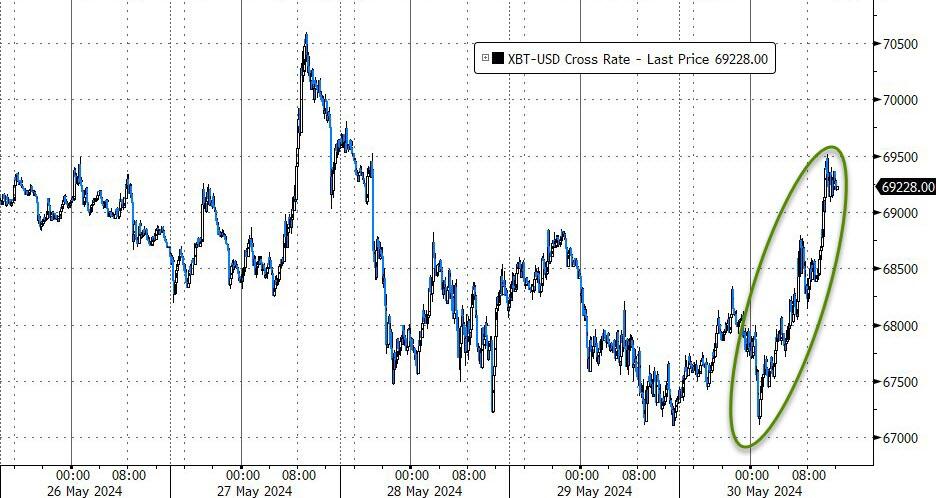
Crude oil prices dived, but gold found support with the precious metal adding almost 1%. Bitcoin joined the party and increased over 2%.
All eyes are now on tomorrow’s personal consumption expenditure price index (PCE), which serves as the Fed’s favorite inflation gauge. It’s expected to come in around 2.7% for April, which is still above the Fed’s 2% target.
2. Current “Buy” Cycles (effective 11/21/2023)
Our Trend Tracking Indexes (TTIs) have both crossed their trend lines with enough strength to trigger new “Buy” signals. That means, Tuesday, 11/21/2023, was the official date for these signals.
If you want to follow our strategy, you should first decide how much you want to invest based on your risk tolerance (percentage of allocation). Then, you should check my Thursday StatSheet and Saturday’s “ETFs on the Cutline” report for suitable ETFs to buy.
3. Trend Tracking Indexes (TTIs)
The bears remained in charge for the second day in a row, as the major indexes retreated again.
Our TTIs bucked the trend and closed higher.
This is how we closed 5/30/2024:
Domestic TTI: +6.23% above its M/A (prior close +5.78%)—Buy signal effective 11/21/2023.
International TTI: +8.10% above its M/A (prior close +7.68%)—Buy signal effective 11/21/2023.
All linked charts above are courtesy of Bloomberg via ZeroHedge.
———————————————————-
WOULD YOU LIKE TO HAVE YOUR INVESTMENTS PROFESSIONALLY MANAGED?
Do you have the time to follow our investment plans yourself? If you are a busy professional who would like to have his portfolio managed using our methodology, please contact me directly to get more details.
—————————————————————-
Contact Ulli