
- Moving the markets
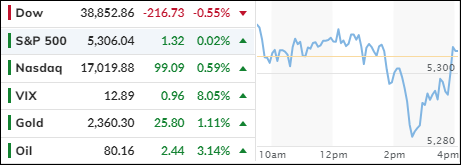
The Nasdaq powered to a new high today, and briefly crossed above its 17k milestone, thanks to Nvidia’s continued upward momentum. The tech-heavy index led the major indexes in a sluggish start to the last trading week of May.
All three major indexes look to close out a strong month after having scored new all-times at various points, despite the Dow pulling back today. Traders interpreted inflation data as “soft,” relentlessly clinging to hope that the Fed’s potential rate cuts might become reality sooner rather than later. Better than expected earnings, thanks to a low bar, lifted bullish sentiment.
On the other hand, some strong economic data points and fresh concerns about consumers pulling back on spending has created a new wildcard, which likely has reigned in optimism for the direction of interest rates. Fed mouthpiece Kashkari did not help matters by adding that he wants to see “many more months” of data pointing to easing inflation before supporting a cut.
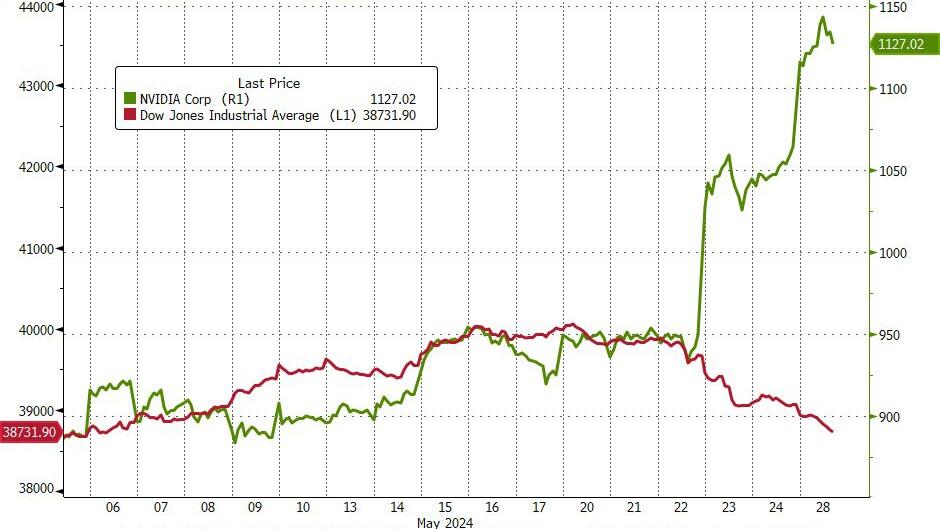
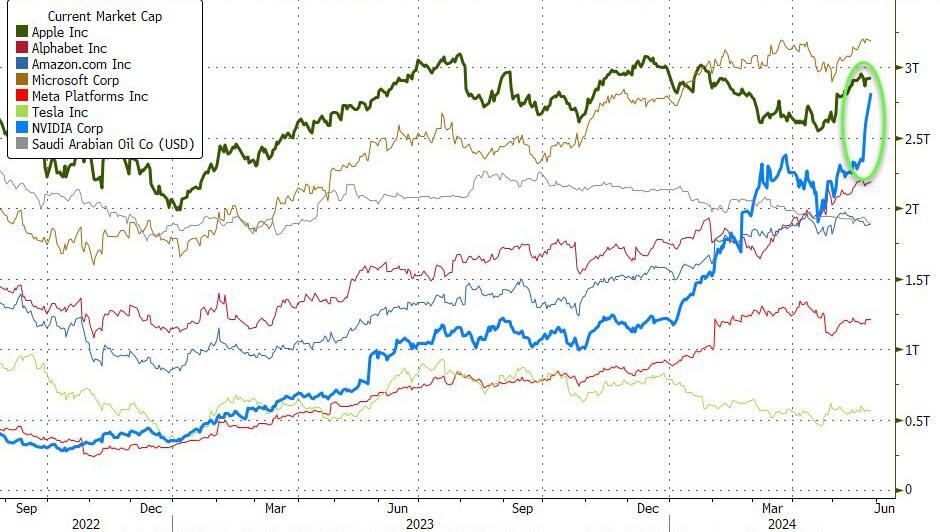
Nvidia owned all bullish sentiment as the stock added over 7% for the session and climbed to within $100 billion of Apple’s market cap.
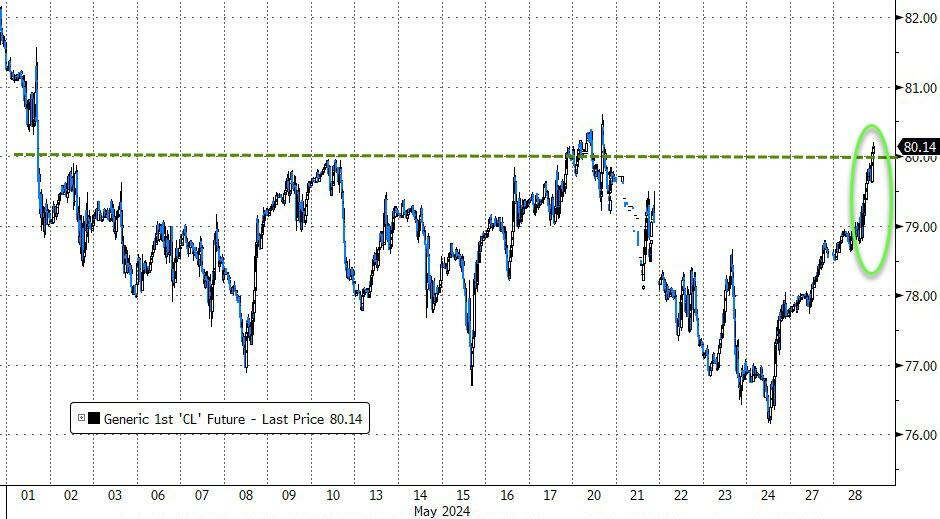
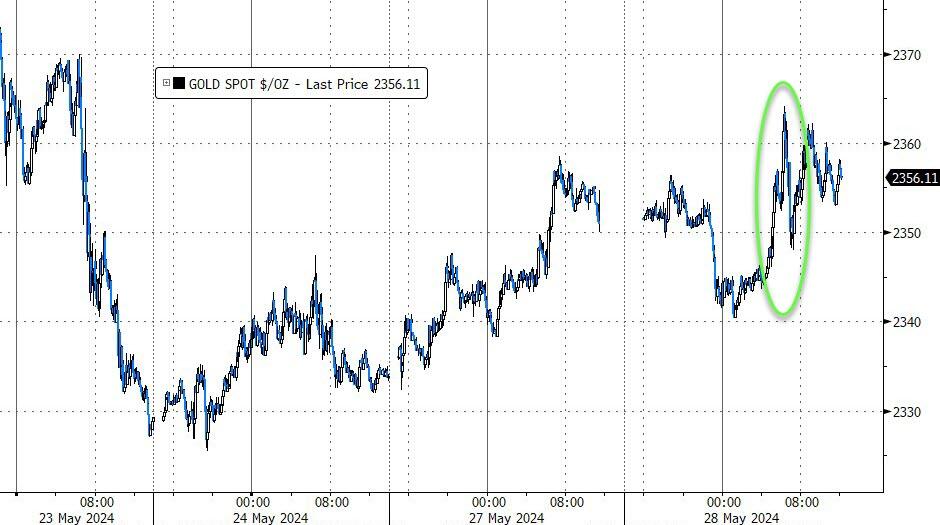
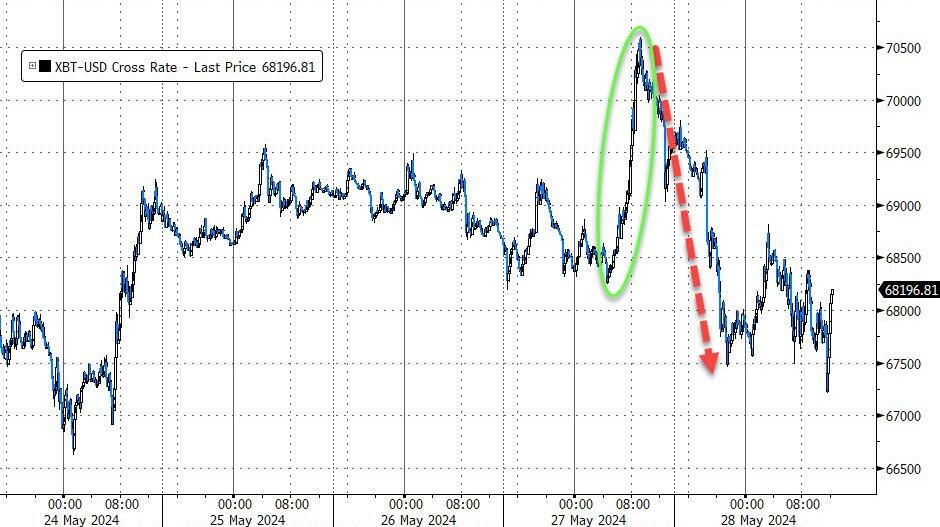
However, other asset classes moved higher as well. Oil prices jumped over 3% to close above $80, gold shot back above $2,350 and Bitcoin touched its $70.5k level before falling back.
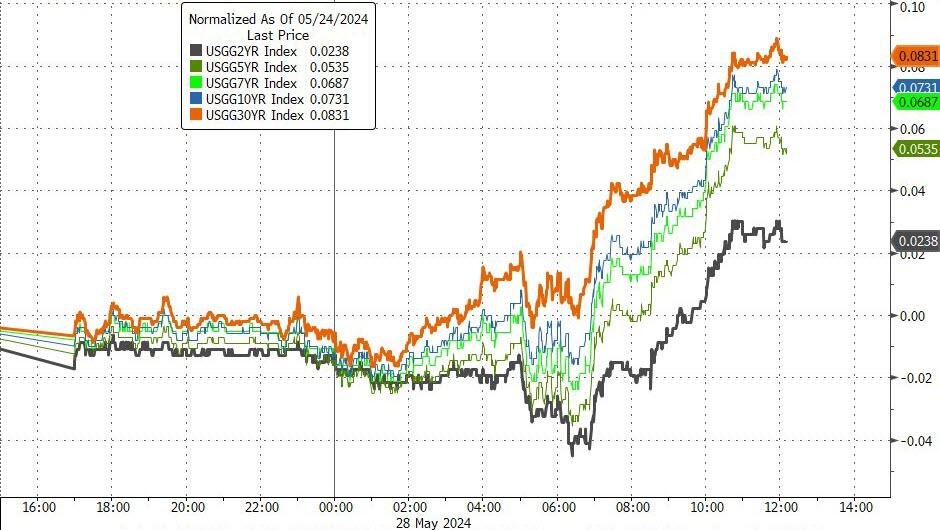
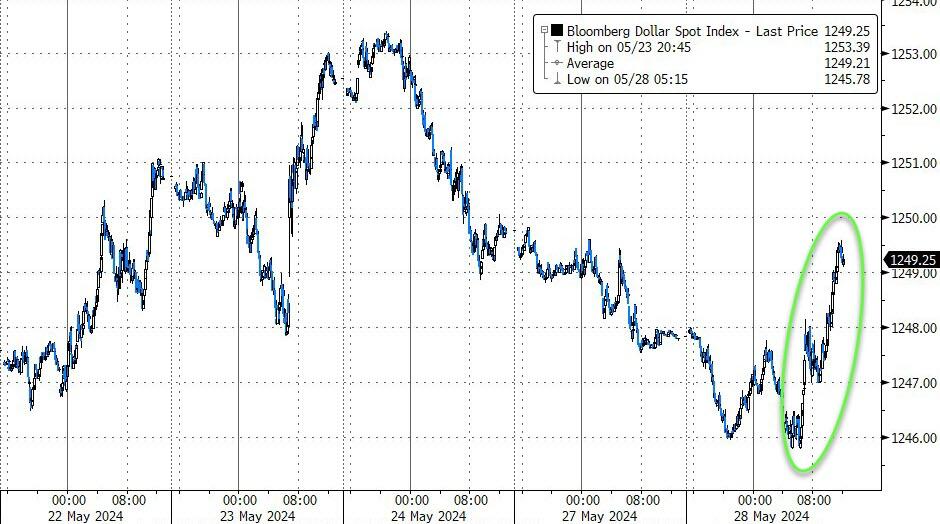
Bond yields headed higher, as some macro data showed signs of improvement, such as home prices and consumer confidence, but inflation expectations were rising. The dollar advanced and followed the direction of yields.
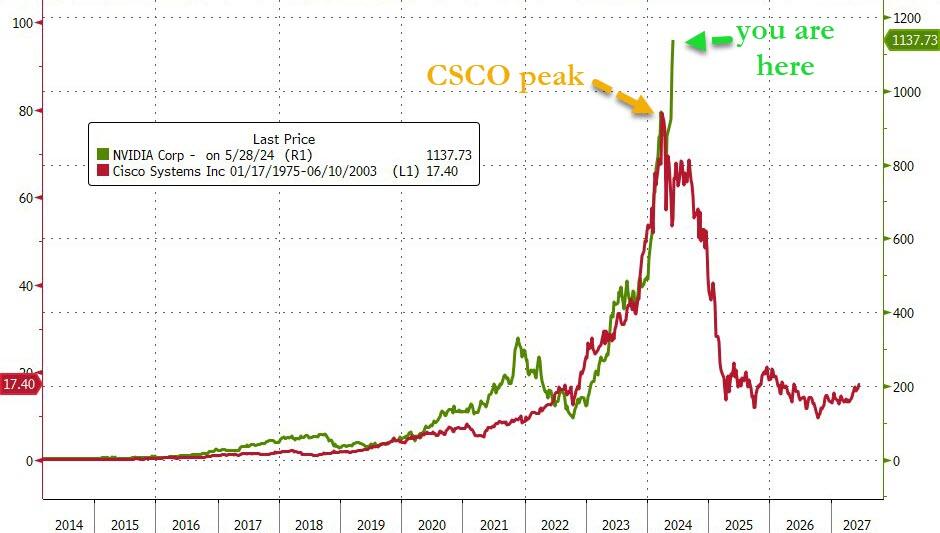
The comparison of Nvidia to Cisco Systems seems to have run its course, as this chart shows.
However, the question is: Can history still repeat itself but just from a higher level?
2. Current “Buy” Cycles (effective 11/21/2023)
Our Trend Tracking Indexes (TTIs) have both crossed their trend lines with enough strength to trigger new “Buy” signals. That means, Tuesday, 11/21/2023, was the official date for these signals.
If you want to follow our strategy, you should first decide how much you want to invest based on your risk tolerance (percentage of allocation). Then, you should check my Thursday StatSheet and Saturday’s “ETFs on the Cutline” report for suitable ETFs to buy.
3. Trend Tracking Indexes (TTIs)
The three major indexes, except the Nasdaq, took a dive late in the session, with only S&P 500 being able to dig itself out of a deep hole, while the Dow lingered in negative territory all day.
Our TTIs whipsawed, with the international one showing more resistance than the domestic one.
This is how we closed 5/28/2024:
Domestic TTI: +6.99% above its M/A (prior close +7.74%)—Buy signal effective 11/21/2023.
International TTI: +9.09% above its M/A (prior close +8.98%)—Buy signal effective 11/21/2023.
All linked charts above are courtesy of Bloomberg via ZeroHedge.
———————————————————-
WOULD YOU LIKE TO HAVE YOUR INVESTMENTS PROFESSIONALLY MANAGED?
Do you have the time to follow our investment plans yourself? If you are a busy professional who would like to have his portfolio managed using our methodology, please contact me directly to get more details.
—————————————————————-
Contact Ulli