ETF Tracker StatSheet
You can view the latest version here.
CONSUMER SPENDING STUMBLES: INFLATION THREAT LOOMS

- Moving the markets
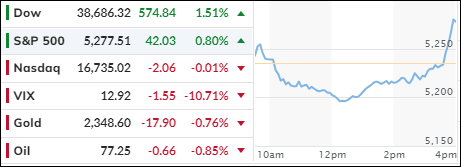
The major indexes started the last day of May in mixed mode, with the Dow being little changed, while the S&P 500 and Nasdaq meandered below their respective unchanged lines.
However, an afternoon melt-up pulled the Dow and S&P out of their doldrums with both indexes closing solidly in the green, while the Nasdaq ended about unchanged.
The Fed’s preferred inflation gauge, the PCE, increased 0.2% in April, which was in line with expectations. The Core PCE rose 2.8% on an annual basis, a tad above the forecast of 2.7%.
On the economic side, consumer spending grew only 0.2% in April, less than hoped for. But when adjusted for inflation spending declined 0.1% from the prior month, confirming that the consumer is not in good shape.
Still, traders were somewhat relieved that these numbers did not turn out to be worse, with hope abounding that slowing spending could lead to lower inflation numbers.
That shows the lack of understanding that the real threat of higher inflation still lies ahead of us and is caused by ever-growing debt and deficits, as there seems to be no end to unrelenting government spending. Have you heard anyone talk about balancing the budget lately?
Be that as it may, this month turned out to be positive for equities, with the S&P 500 being up some 4.8%, after having lost 4% the prior month.
Hard and soft data were mixed this week, which in the end caused a resurrection in rate-cut hopes.
The MAG7 stocks lost momentum, while bond yields showed a mixed picture. The dollar moved higher after bouncing off its unchanged line, gold pulled back from yesterday’s gains, as Bitcoin dropped but found support at its $67k level. Crude oil, after a spike midweek, gave back all advances for the week.
Another divergence, between gold and the 10-year real rate, has created another alligator snout, which is bound to close at some time.
I am pondering: Will gold remain the beneficiary?
2. Current “Buy” Cycles (effective 11/21/2023)
Our Trend Tracking Indexes (TTIs) have both crossed their trend lines with enough strength to trigger new “Buy” signals. That means, Tuesday, 11/21/2023, was the official date for these signals.
If you want to follow our strategy, you should first decide how much you want to invest based on your risk tolerance (percentage of allocation). Then, you should check my Thursday StatSheet and Saturday’s “ETFs on the Cutline” report for suitable ETFs to buy.
3. Trend Tracking Indexes (TTIs)
Today, we witnessed another volatile session, in which the bulls and bears continued their game of tug-of-war. The bulls won the contest, thanks to a last hour ramp-a-thon, which pushed 2 of the 3 major indexes to a green close.
Our TTIs benefited from this battle and advanced.
This is how we closed 5/31/2024:
Domestic TTI: +7.33% above its M/A (prior close +6.23%)—Buy signal effective 11/21/2023.
International TTI: +8.59% above its M/A (prior close +8.10%)—Buy signal effective 11/21/2023.
All linked charts above are courtesy of Bloomberg via ZeroHedge.
———————————————————-
WOULD YOU LIKE TO HAVE YOUR INVESTMENTS PROFESSIONALLY MANAGED?
Do you have the time to follow our investment plans yourself? If you are a busy professional who would like to have his portfolio managed using our methodology, please contact me directly to get more details.
—————————————————————-
Contact Ulli