- Moving the markets
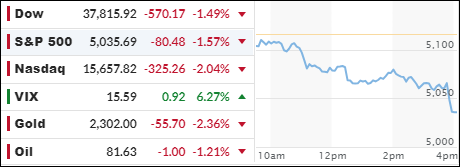
As April ended, the major stock indexes concluded the month on a downward trajectory, spurred by wage data that surpassed expectations and reignited concerns about inflation. This comes just before the Federal Reserve’s impending interest rate decision.
The employment cost index, which tracks wages and benefits, rose by 1.2% in the March quarter, exceeding the predicted 1%. This news prompted a surge in Treasury yields, with the 2-year yield surpassing and holding the 5% threshold for the first time.
Despite these figures, Wall Street remains unconvinced that the Federal Reserve will shift its current stance of not rushing to ease monetary policy. Similarly, the data does not seem to be compelling enough to prompt an immediate increase in interest rates. Traders continue to anticipate a modest rate cut of one quarter percentage point in 2024, even as persistent inflation and a robust economy suggest that the Fed may maintain higher rates for an extended period.
The central bank is widely expected to maintain the current interest rates, but there is growing concern that Jerome Powell, the Fed Chair, may express a more hawkish outlook in his comments following the meeting, especially considering recent reports indicating rising inflation.
The trading day was marred by a series of negative economic indicators: Case-Shiller home prices surged unexpectedly, consumer confidence plummeted, and the Dallas Fed Services index fell sharply.
The markets floundered, with stocks, bonds, crude oil, and Bitcoin all weakening as the month concluded. However, the dollar experienced a rally. Gold, despite suffering losses on the day, managed to post solid gains for the month.
April marked the first month of losses for stocks since the Federal Reserve’s policy shift in October 2023. It was the most challenging month for the Dow Jones Industrial Average since September 2022, and the Nasdaq experienced its most significant monthly decline since September 2023.
The group of MAG 7 stocks, which includes some of the largest tech companies, also ended the month in the red, recording their first monthly loss since October and their worst performance since September.
Given the current economic landscape, I can’t help but wonder:
When will the Nasdaq align with the lowered expectations for rate cuts?
2. Current “Buy” Cycles (effective 11/21/2023)
Our Trend Tracking Indexes (TTIs) have both crossed their trend lines with enough strength to trigger new “Buy” signals. That means, Tuesday, 11/21/2023, was the official date for these signals.
If you want to follow our strategy, you should first decide how much you want to invest based on your risk tolerance (percentage of allocation). Then, you should check my Thursday StatSheet and Saturday’s “ETFs on the Cutline” report for suitable ETFs to buy.
3. Trend Tracking Indexes (TTIs)
On the final day of April, negative news dominated the headlines, causing bullish sentiment to fade. All markets experienced losses, with the S&P 500 declining by approximately 4.1% for the month.
Despite this downturn, our TTIs also pulled back, but not significantly enough to warrant any adjustments to our holdings.
This is how we closed 4/30/2024:
Domestic TTI: +5.96% above its M/A (prior close +7.51%)—Buy signal effective 11/21/2023.
International TTI: +6.76% above its M/A (prior close +7.76%)—Buy signal effective 11/21/2023.
All linked charts above are courtesy of Bloomberg via ZeroHedge.
———————————————————-
WOULD YOU LIKE TO HAVE YOUR INVESTMENTS PROFESSIONALLY MANAGED?
Do you have the time to follow our investment plans yourself? If you are a busy professional who would like to have his portfolio managed using our methodology, please contact me directly to get more details.
—————————————————————-
Contact Ulli