
- Moving the markets
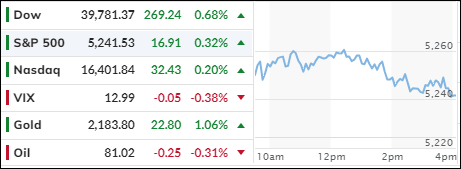
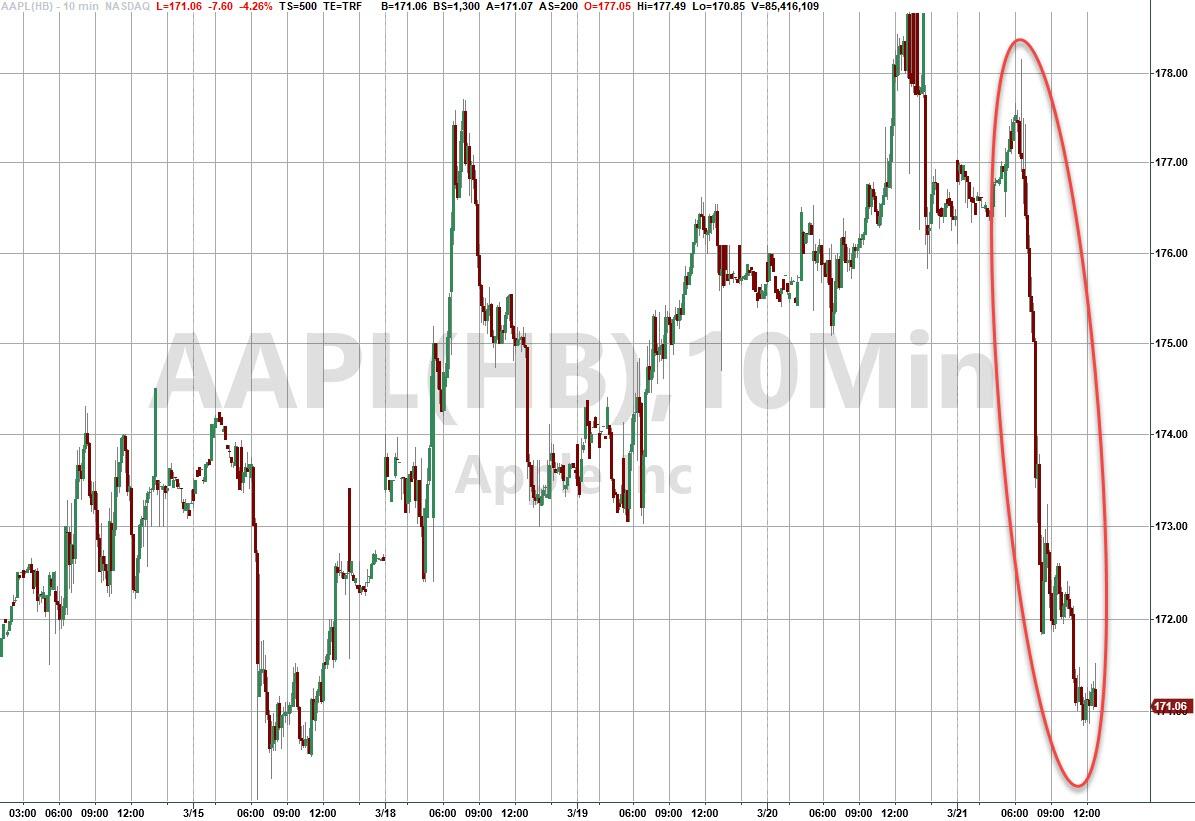
Today, the stock market saw a significant uptrend, with technology shares outshining the rest. This surge builds upon the previous session’s momentum that set new records on Wall Street. Leading the charge, mega-cap technology companies like Meta Platforms, Microsoft, and Amazon each saw gains of at least 1%. In contrast, Apple experienced a 3% decline amid an antitrust lawsuit filed by the Justice Department.
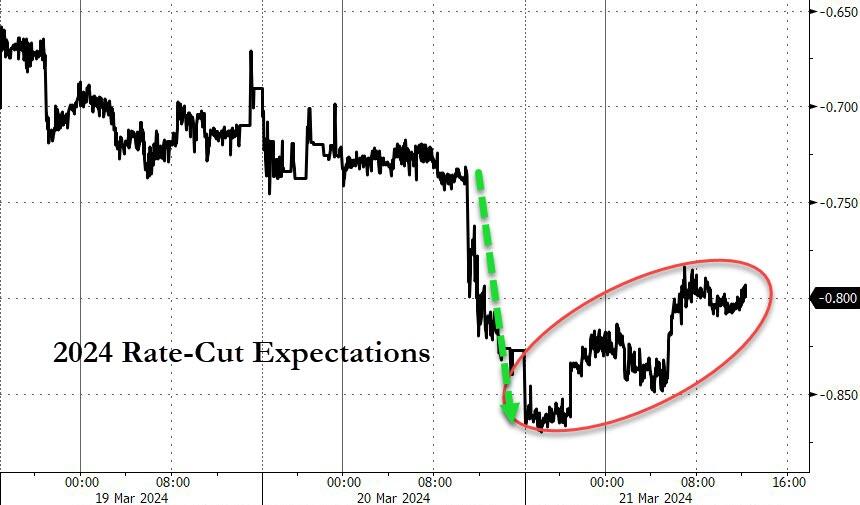
The market’s upward trajectory continued from Thursday, propelling the three major indexes to unprecedented closing highs. Notably, the S&P 500 surpassed the 5,200 level for the first time. These gains align with the Federal Reserve’s recent announcement, which signals three potential interest rate cuts this year while maintaining current borrowing costs.
Federal Reserve Chairman Jerome Powell, in today’s press conference, hinted at possible rate reductions if the downward trend in inflation persists. However, the specifics of these cuts remain undisclosed.
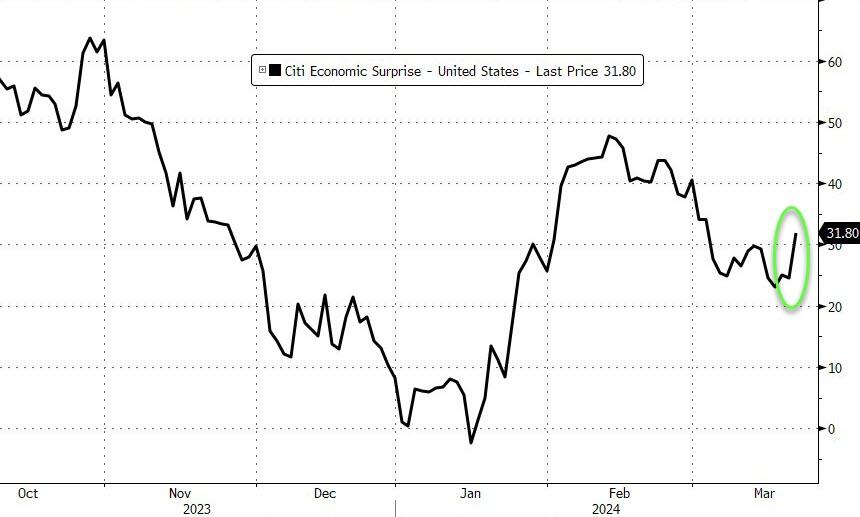
A slew of positive economic indicators—including the Philly Fed, jobless claims, PMIs, Leading Indicators, and existing home sales—contributed to a rise in the Citi Economic Surprise Index. Yet, this wave of optimism has paradoxically dampened the anticipation for rate cuts in 2024.
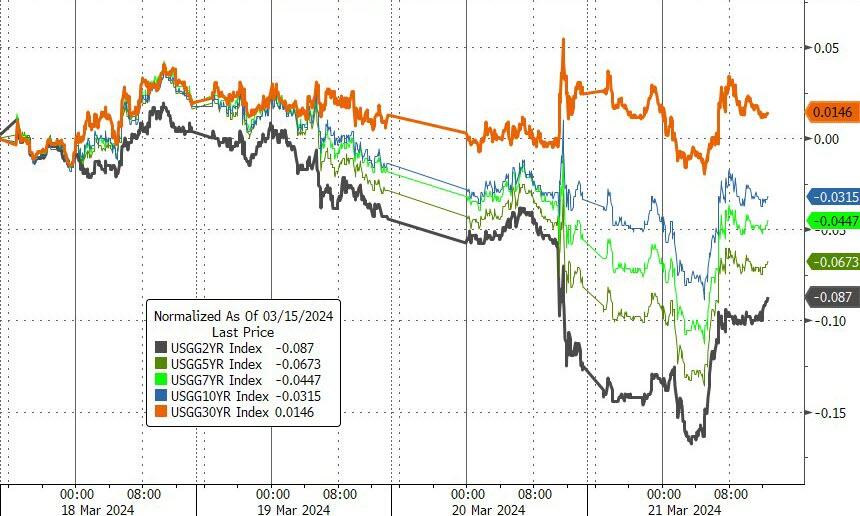
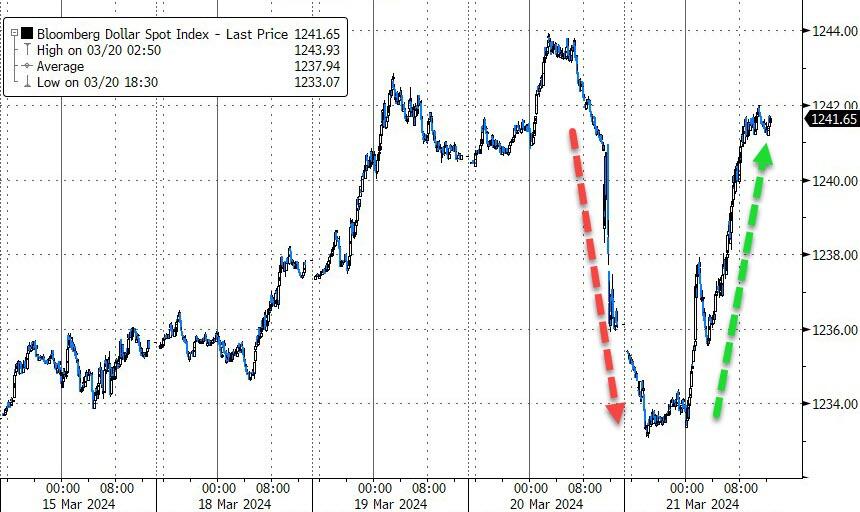
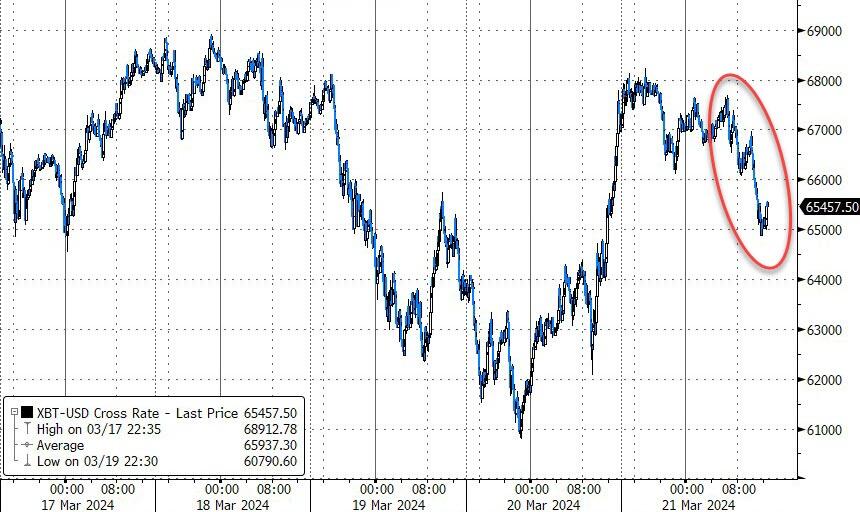
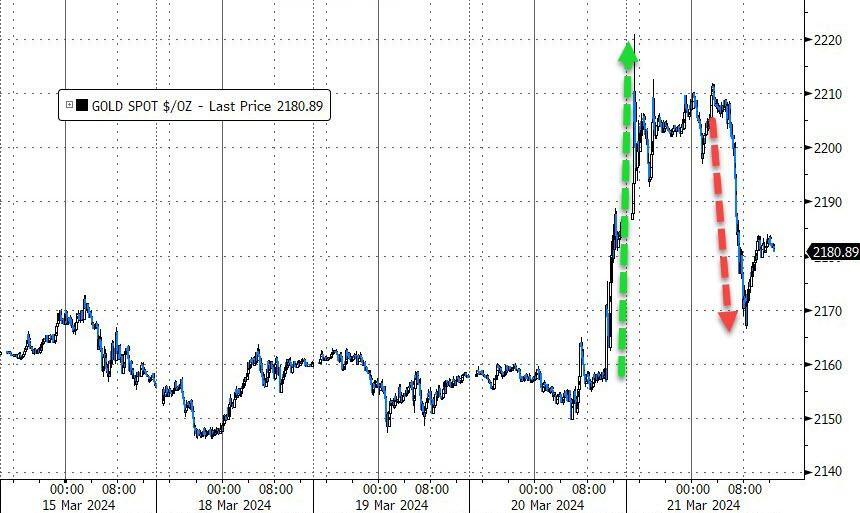
As bond yields showed mixed signals, the dollar made a strong comeback, nearly erasing the losses from the previous day. Meanwhile, Bitcoin edged closer to the $65k mark, and gold prices shifted, contradicting the previous day’s trend. It’s important to note a discrepancy in the MarketWatch chart numbers above.
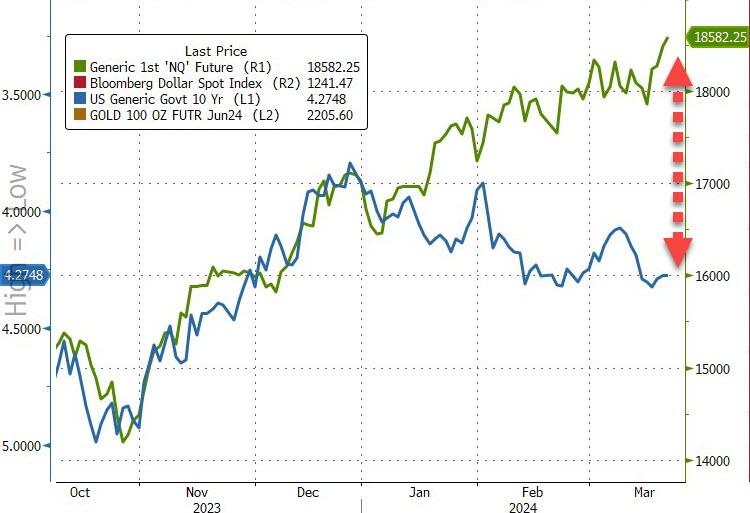
Additionally, a notable divergence between the Nasdaq and the 10-year yield has emerged this year, leading to the question:
Which will yield first, the Nasdaq or the bond market?
2. Current “Buy” Cycles (effective 11/21/2023)
Our Trend Tracking Indexes (TTIs) have both crossed their trend lines with enough strength to trigger new “Buy” signals. That means, Tuesday, 11/21/2023, was the official date for these signals.
If you want to follow our strategy, you should first decide how much you want to invest based on your risk tolerance (percentage of allocation). Then, you should check my Thursday StatSheet and Saturday’s “ETFs on the Cutline” report for suitable ETFs to buy.
3. Trend Tracking Indexes (TTIs)
While the major indexes initially bounced higher, they were unable to sustain that momentum. However, they still managed to maintain enough bullish strength for a positive closing.
Notably, our TTIs demonstrated more resilience than the S&P 500, closing solidly in the green.
This is how we closed 3/21/2024:
Domestic TTI: +11.55% above its M/A (prior close +10.79%)—Buy signal effective 11/21/2023.
International TTI: +11.10% above its M/A (prior close +10.47%)—Buy signal effective 11/21/2023.
All linked charts above are courtesy of Bloomberg via ZeroHedge.
———————————————————-
WOULD YOU LIKE TO HAVE YOUR INVESTMENTS PROFESSIONALLY MANAGED?
Do you have the time to follow our investment plans yourself? If you are a busy professional who would like to have his portfolio managed using our methodology, please contact me directly to get more details.
—————————————————————-
Contact Ulli