- Moving the markets
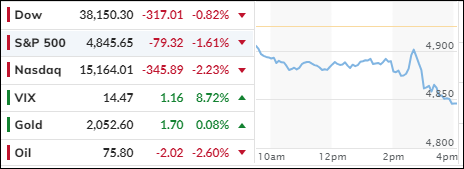
Today was a bad day for tech stocks, as Microsoft and Alphabet dragged down the whole sector with their disappointing performance. Alphabet’s shares fell over 5%, their worst drop since last October, as their ad revenue failed to impress investors despite beating earnings and sales expectations.
Microsoft and AMD also lost 1.3% and 4% of their value, respectively, after giving weak guidance for the future. The tech sector, which has been the main driver of the market rally since 2023, is now valued at almost 29 times its 2024 earnings.
That’s pretty high, even for tech. To justify these prices, the tech companies need to show some serious growth in their profits. Otherwise, they might be in for a rude awakening.
Adding to the market woes were the comments from Fed chairman Powell, who dashed the hopes of many traders who wanted a rate cut in March. Powell said the Fed was not ready to lower the rates until inflation reached 2%.
He did leave some room for a possible cut later, but he also removed a sentence from the statement that said the U.S. banking system was sound and resilient. That’s not very reassuring, especially after the trouble at NY Community Bank today.
ZeroHedge wondered if the Fed was lying before or just telling the truth now. Either way, it’s not a good look for the Fed.
The result was a bloodbath on Wall Street. The Mag7 stocks, which include Apple, Amazon, Facebook, Google, Microsoft, Netflix, and Tesla, had their worst day since December 2022.
Bond yields fell, but the 10-year Treasury bounced back to 4% by the end of the day. The dollar and gold reversed their course and ended at the opposite ends of the spectrum. Oil prices also slid on weak data.
It was a crazy day on Wall Street, and with Powell’s hawkish tone on interest rates, I wonder if the bulls can keep their spirits up without a rate cut in March.
2. Current “Buy” Cycles (effective 11/21/2023)
Our Trend Tracking Indexes (TTIs) have both crossed their trend lines with enough strength to trigger new “Buy” signals. That means, Tuesday, 11/21/2023, was the official date for these signals.
If you want to follow our strategy, you should first decide how much you want to invest based on your risk tolerance (percentage of allocation). Then, you should check my Thursday StatSheet and Saturday’s “ETFs on the Cutline” report for suitable ETFs to buy.
3. Trend Tracking Indexes (TTIs)
The stock market plunged today as investors were disappointed by the low profits/outlooks of technology companies and the possibility of higher interest rates in the future. Many had hoped for a rate cut in March, but that seems unlikely now.
Our TTIs also fell, but they are still above the level that indicates a positive market trend.
This is how we closed 1/31/2024:
Domestic TTI: +6.59% above its M/A (prior close +7.98%)—Buy signal effective 11/21/2023.
International TTI: +6.78% above its M/A (prior close +7.27%)—Buy signal effective 11/21/2023.
All linked charts above are courtesy of Bloomberg via ZeroHedge.
———————————————————-
WOULD YOU LIKE TO HAVE YOUR INVESTMENTS PROFESSIONALLY MANAGED?
Do you have the time to follow our investment plans yourself? If you are a busy professional who would like to have his portfolio managed using our methodology, please contact me directly to get more details.
—————————————————————-
Contact Ulli