
- Moving the markets
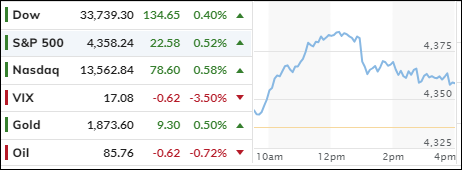
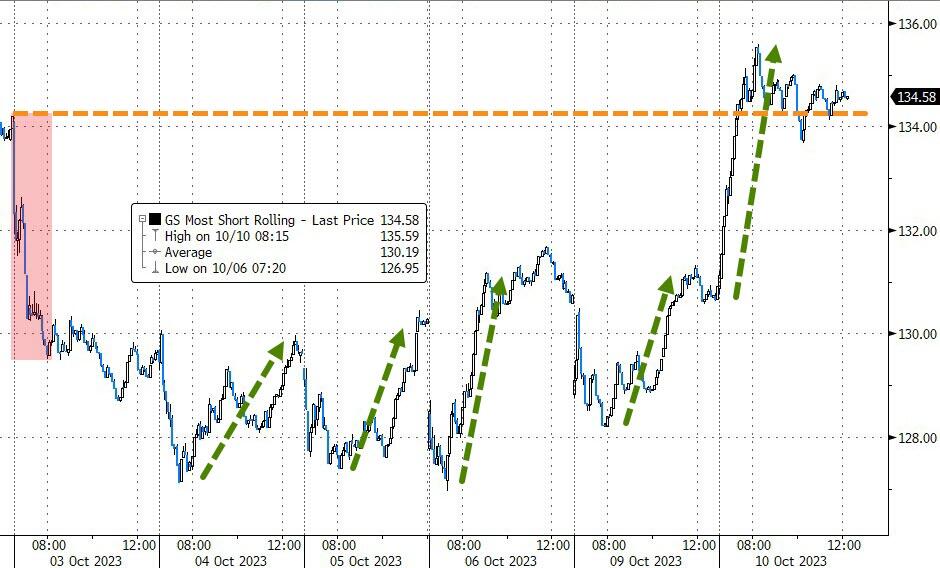
U.S. stocks went up on Tuesday, thanks to lower Treasury yields and a short squeeze.
Wall Street was busy assessing the geopolitical risks of the Israel-Hamas war, which has been going on for longer than some Netflix shows.
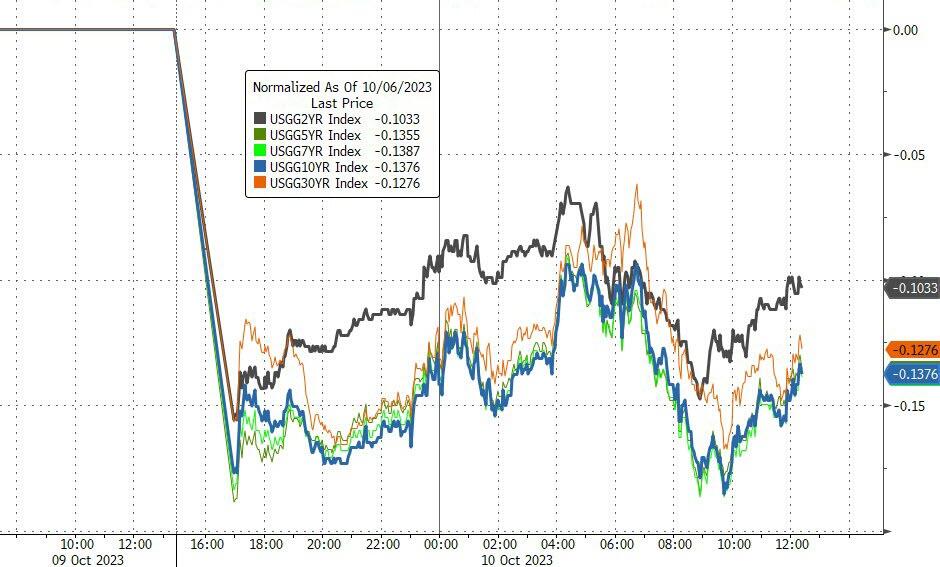
The 10-year Treasury yield ended down 15 basis points to 4.65%, as investors flocked to the safe haven of bonds amid the conflict. The bond market was closed on Monday for Columbus Day, so this was its first chance to react to the war.
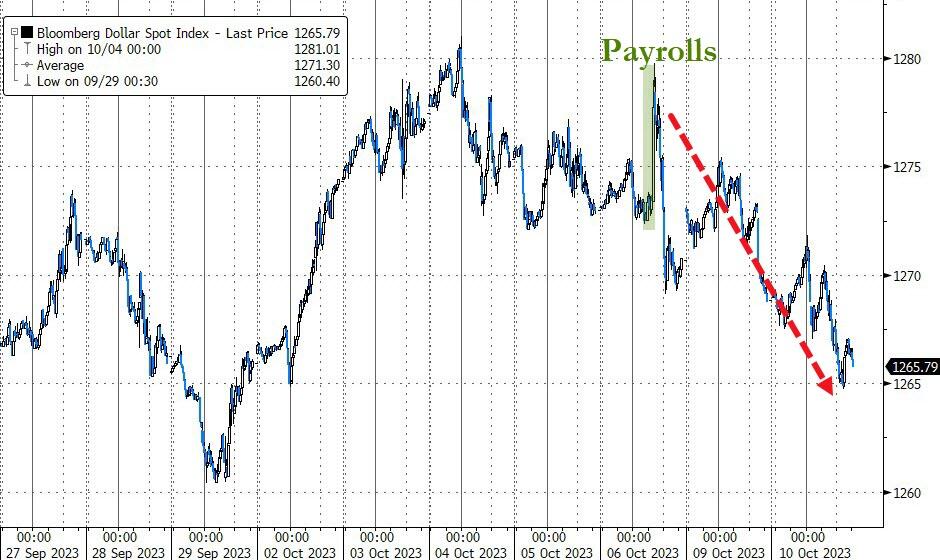
The drop in yields gave stocks a boost, as Wall Street was worried about the recent spike in interest rates. Investors may also be ignoring the geopolitical risks caused by the conflict, helped by Friday’s allegedly strong September jobs report and optimism ahead of a bunch of earnings this week.
However, there was a buzzkill in the form of Paul Tudor Jones, the legendary hedge fund manager who said that he doesn’t like stocks right now. He prefers bitcoin and gold, as he thinks the US Treasury can’t protect investors like it used to.
I agree with him, and our Trend Tracking Indexes (TTIs) confirm the uncertainty and instability we are in. The bear market rally of the last few days has only helped investors recover some of their losses, which they suffered after our Sell signal on 9/22/23.
As I write this, I think the market may go up another 1-1.25% before hitting resistance and reversing. The inflation reports tomorrow, and Thursday (PPI and CPI), will likely affect market direction.
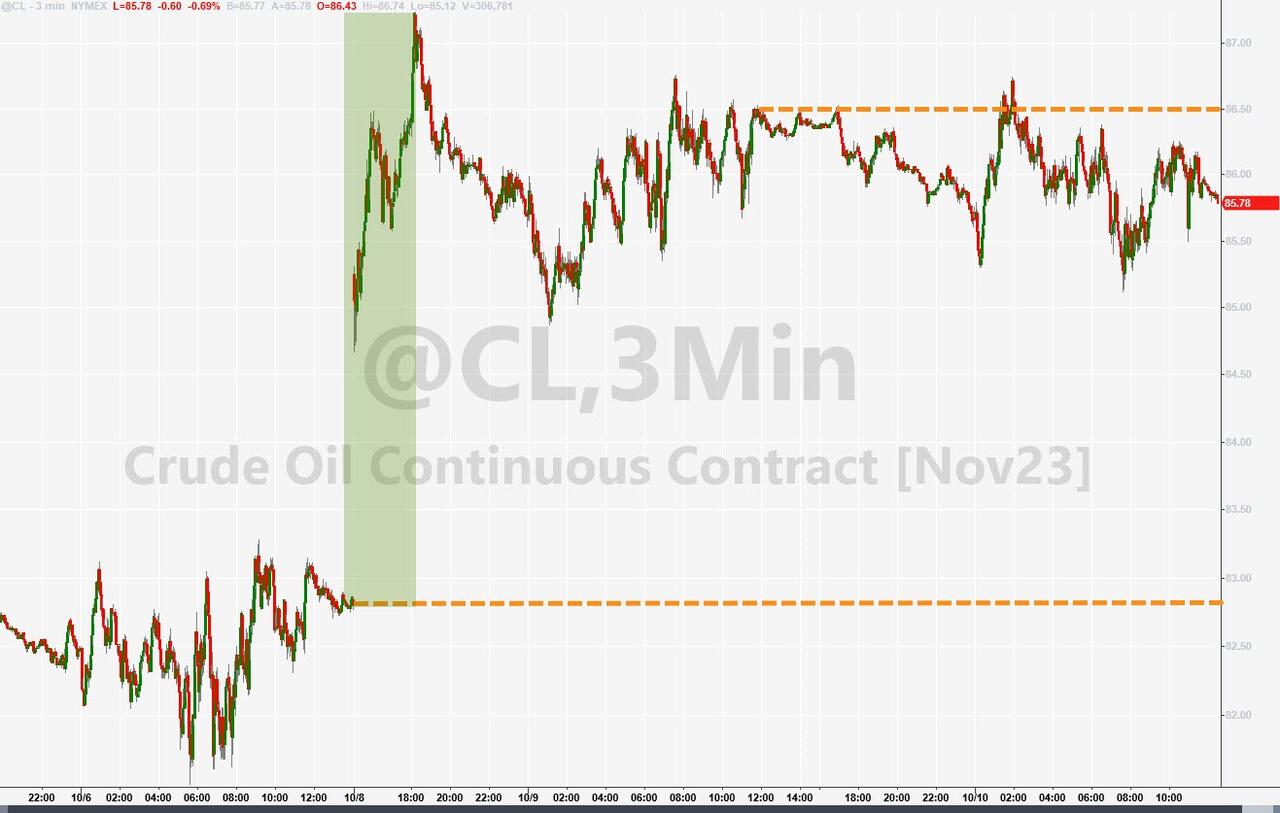
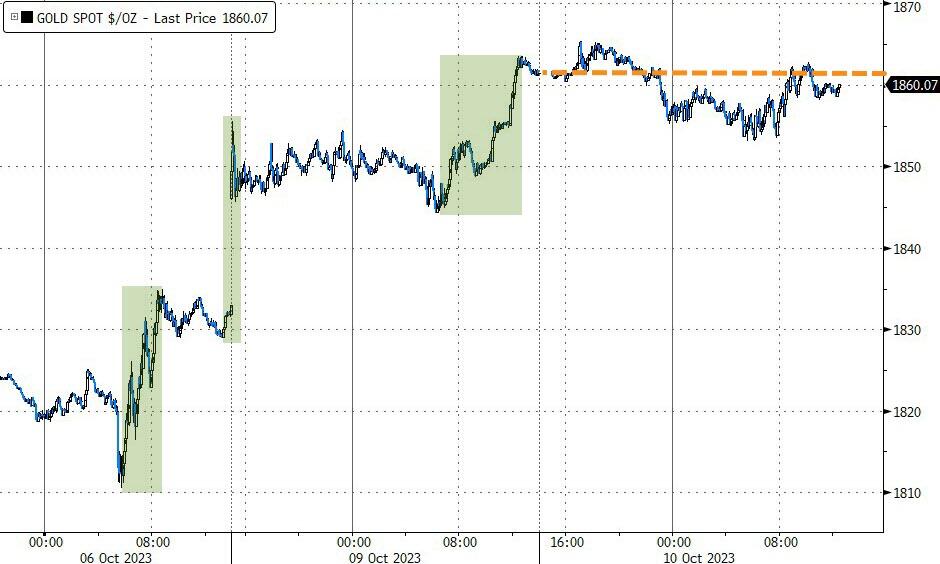
The dollar continued to slide, oil prices were slightly lower, and gold was flat but holding on to its gains.
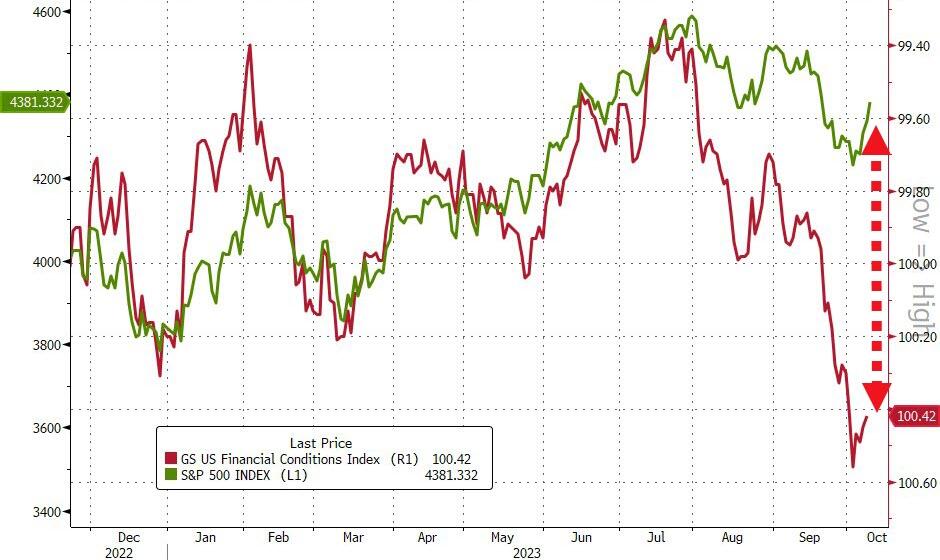
Looking at this chart, it seems that financial conditions are too tight for stocks to be this high. Or is this just a preview of what’s coming soon?
2. “Buy” Cycle (12/1/22 to 9/21/2023)
The current Domestic Buy cycle began on December 1, 2022, and concluded on September 21, 2023, at which time we liquidated our holdings in “broadly diversified domestic ETFs and mutual funds”.
Our International TTI has now dipped firmly below its long-term trend line, thereby signaling the end of its current Buy cycle effective 10/3/23.
We have kept some selected sector funds. To make informed investment decisions based on your risk tolerance, you can refer to my Thursday StatSheet and Saturday’s “ETFs on the Cutline” report.
Considering the current turbulent times, it is prudent for conservative investors to remain in money market funds—not bond funds—on the sidelines.
3. Trend Tracking Indexes (TTIs)
The stock market continued to recover from the recent downturn, as lower bond yields and a surge in buying pressure boosted the prices of the most shorted stocks.
Our Trend Tracking Indexes (TTIs) moved closer to their respective moving averages, which indicate the direction of the market trend.
The International TTI is now close to crossing above its moving average, which would signal a positive trend change.
The Domestic TTI, however, is still below its moving average and needs more momentum to turn bullish.
This is how we closed 10/10/2023:
Domestic TTI: -2.28% below its M/A (prior close –3.03%)—Sell signal effective 9/22/2023.
International TTI: -0.19% below its M/A (prior close -1.58%)—Sell signal effective 10/3/2023.
All linked charts above are courtesy of Bloomberg via ZeroHedge.
Contact Ulli