ETF Tracker StatSheet
You can view the latest version here.
GETTING SLAMMED

- Moving the markets
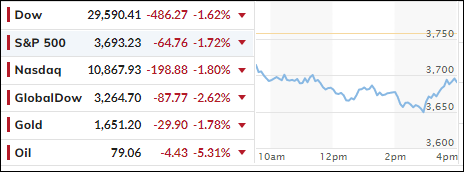
Thanks to a last hour comeback, the markets were able to avoid a far worse outcome, as the Dow was down over 800 points, which was its low for the session.
Still, the major indexes, and the broad market, got hammered again, with the Dow closing below its 30k level for the first time since June 17 and scored their 5th negative week out of six, as the S&P 500 tumbled 5.2%.
It was a brutal five trading days, as surging rates and foreign currency upheaval left their marks and confirmed that a global recession is indeed a real possibility. It appears that the markets have now transitioned from the meme of inflation concerns to worries about an aggressive Fed trying to slay the former at the cost of a sharp economic slowdown.
Carnage best describes the market action of today, this week, this month, and this year, as ZeroHedge correctly called it. After all, with the S&P 500 having lost 10% of its value in just the past two weeks, simply goes to show how fast things can change when reckless monetary policy comes to an end, and all bubbles, real estate, bonds, and stocks, begin to burst.
Bond yields surged this week with the 10-year getting close to touching its highest point since April 2010. The US Dollar rose causing the British Pound to dive to its lowest point since February 1985. Ouch!
If you have not learned by now that there are times to be out of the market and on the sidelines, you should not read this blog. After all, I have been pounding on that theme for decades, namely that all good things, like artificially low interest rates, as well as Quantitative Easing (QE) programs, will have eventual consequences like inflation and subsequently surging interest rates, which is what we are seeing right now.
What could change the current scenario?
If the recession/depression gets so bad that the Fed will be forced to pivot and reverse its strategy from hawkish to dovish, that would pump some life not only into equities but will also worsen inflation. Right now, there is no good outcome other than avoiding further portfolio damage by being on the sidelines, so you can avoid participating in a scenario that gets worse, before it gets much worse.
There is a ‘lost generation’ of money managers out there, who have never seen a bear market and have only, throughout most of their careers, lived by the mantra that the Fed will bail them out via easy monetary policy, should markets decline by some 20%. That time is over, with ZeroHedge quoting the following:
Back in February 2020, the former Dallas Fed chief offered some more thoughts about Wall Street’s ‘lost generation’.
“The Fed has created this dependency and there’s an entire generation of money-managers who weren’t around in ’74, ’87, the end of the ’90s, and even 2007-2009… and have only seen a one-way street… of course they’re nervous.”
“The question is – do you want to feed that hunger? Keep applying that opioid of cheap and abundant money?”
Simply put, investors must be weaned off their dependency on a Fed put and accept the reality that the ‘wealth’ they thought they had was paper profits and not real.
2. ETFs in the Spotlight
In case you missed the announcement and description of this section, you can read it here again.
It features some of the 10 broadly diversified domestic and sector ETFs from my HighVolume list as posted every Saturday. Furthermore, they are screened for the lowest MaxDD% number meaning they have been showing better resistance to temporary sell offs than all others over the past year.
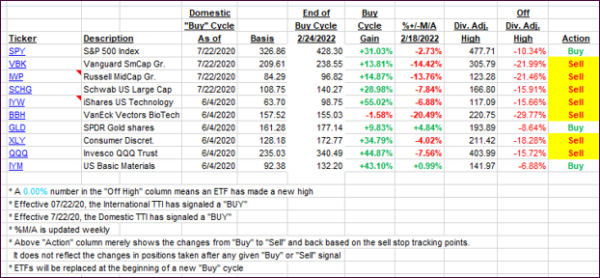
The below table simply demonstrates the magnitude with which these ETFs are fluctuating above or below their respective individual trend lines (%+/-M/A). A break below, represented by a negative number, shows weakness, while a break above, represented by a positive percentage, shows strength.
For hundreds of ETF choices, be sure to reference Thursday’s StatSheet.
For this closed-out domestic “Buy” cycle (2/24/2022), here’s how some of our candidates have fared. Keep in mind that our Domestic Trend Tracking Index (TTI) signaled a “Sell” on that date, which overrode the existing “Buys” shown for SPY and IYM:

Click image to enlarge.
Again, the %+/-M/A column above shows the position of the various ETFs in relation to their respective long-term trend lines, while the trailing sell stops are being tracked in the “Off High” column. The “Action” column will signal a “Sell” once the -12% point has been taken out in the “Off High” column, which has replaced the prior -8% to -10% limits.
3. Trend Tracking Indexes (TTIs)
Our TTIs slipped again and are now deeply entrenched in bear market territory.
This is how we closed 09/23/2022:
Domestic TTI: -11.18% below its M/A (prior close -10.51%)—Sell signal effective 02/24/2022.
International TTI: -14.77% below its M/A (prior close -12.93%)—Sell signal effective 03/08/2022.
Disclosure: I am obliged to inform you that I, as well as my advisory clients, own some of the ETFs listed in the above table. Furthermore, they do not represent a specific investment recommendation for you, they merely show which ETFs from the universe I track are falling within the specified guidelines.
All linked charts above are courtesy of Bloomberg via ZeroHedge.
———————————————————-
WOULD YOU LIKE TO HAVE YOUR INVESTMENTS PROFESSIONALLY MANAGED?
Do you have the time to follow our investment plans yourself? If you are a busy professional who would like to have his portfolio managed using our methodology, please contact me directly to get more details.
Contact Ulli