ETF Tracker StatSheet
You can view the latest version here.
A LOSING WEEK ENDS ON A POSITIVE NOTE

- Moving the markets
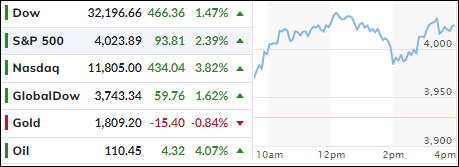
After many head fakes over the past few weeks, an early bounce found some staying power which, despite a mid-day pullback, had enough bullish support to propel the major indexes to a green close.
Nevertheless, this feel-good session was not enough to wipe out the past 4 days of losses, so the indexes ended the week in the red, with the S&P 500 surrendering some 2.4%. However, today’s comeback was broad based, because 93% of all S&P 500 members closed on a positive note.
The Nasdaq led the charge with an almost 4% gain supported by some of the beaten down heavyweights like Apple, Nvidia, Tesla and Meta Platforms, which finally staged a comeback.
Still, YTD, the Nasdaq is down some 26%, while the S&P 500 has suffered a drop of over 17%, a slide that covers now the sixth week in a row. If there is no upside follow through next week, today’s session may turn out to be nothing more than another dead-cat-bounce in an ongoing bear market.
For sure, tumbling bond yields helped today’s bullish theme, even though the 10-year closed at 2.92%, up from yesterday’s 2.82% but way below the 3.2% level it touched earlier in the week.
One arena that can’t seem to find some solid footing has been precious metals. Gold slipped again and reached its lowest level since February, according to ZeroHedge, and dipped a tad into the red YTD (-0.46%).
There are several scenarios on deck all depending on the actions of the Fed. This chart by Bloomberg demonstrated the various outcomes and their effects on the S&P 500 price levels. Should Stagflation be the potential result, the S&P 500 would have shed some 40% from current levels.
Ouch!
2. ETFs in the Spotlight
In case you missed the announcement and description of this section, you can read it here again.
It features some of the 10 broadly diversified domestic and sector ETFs from my HighVolume list as posted every Saturday. Furthermore, they are screened for the lowest MaxDD% number meaning they have been showing better resistance to temporary sell offs than all others over the past year.
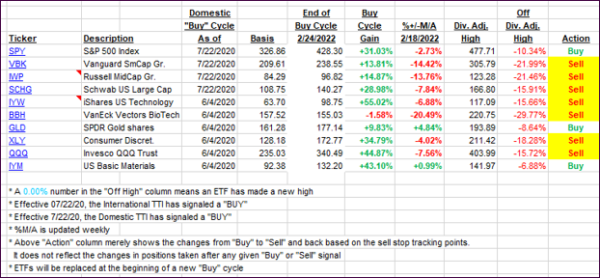
The below table simply demonstrates the magnitude with which these ETFs are fluctuating above or below their respective individual trend lines (%+/-M/A). A break below, represented by a negative number, shows weakness, while a break above, represented by a positive percentage, shows strength.
For hundreds of ETF choices, be sure to reference Thursday’s StatSheet.
For this closed-out domestic “Buy” cycle (2/24/2022), here’s how some of our candidates have fared:

Click image to enlarge.
Again, the %+/-M/A column above shows the position of the various ETFs in relation to their respective long-term trend lines, while the trailing sell stops are being tracked in the “Off High” column. The “Action” column will signal a “Sell” once the -12% point has been taken out in the “Off High” column, which has replaced the prior -8% to -10% limits.
3. Trend Tracking Indexes (TTIs)
Our TTI’s recovered from the recent drubbing due to today’s rebound being broad based.
This is how we closed 05/13/2022:
Domestic TTI: -6.65% below its M/A (prior close -9.26%)—Sell signal effective 02/24/2022.
International TTI: -7.54% below its M/A (prior close -8.76%)—Sell signal effective 03/08/2022.
Disclosure: I am obliged to inform you that I, as well as my advisory clients, own some of the ETFs listed in the above table. Furthermore, they do not represent a specific investment recommendation for you, they merely show which ETFs from the universe I track are falling within the specified guidelines.
All linked charts above are courtesy of Bloomberg via ZeroHedge.
———————————————————-
WOULD YOU LIKE TO HAVE YOUR INVESTMENTS PROFESSIONALLY MANAGED?
Do you have the time to follow our investment plans yourself? If you are a busy professional who would like to have his portfolio managed using our methodology, please contact me directly or get more details.
Contact Ulli