ETF Tracker StatSheet
You can view the latest version here.
DIVING INTO THE WEEKEND

- Moving the markets
As anticipated, volatility reared its ugly head and sent the markets on another roller coaster ride. Despite a variety of rebound attempts, the bulls were not able to achieve a green close, as the bears prevailed with the major indexes tumbling. Even a short squeeze could not change the negative directional tone.
The Dow fared the worst, followed by the S&P 500, but the Nasdaq managed to cling to its unchanged line yet, in the end, closed a tad below it. $4.3 trillion in options expirations took their toll, but the losses were moderate given that we are still within a few percentage points of the all-time highs.
For the week, the markets ended down with the S&P 500 surrendering some 1.9%, the Dow dropping 1.7%, while the Nasdaq was hit the worst and tanked nearly 3%. Of course, volatility may stay with us throughout the remainder of the year, as falling trading volumes tend to cause a choppier environment.
Bond yields slipped on the week, the US Dollar swung wildly but, in the end, closed higher. Gold rallied after showing weakness on Monday through Wednesday but picked up strong upward momentum, which propelled higher for the past trading days but left it a tad short of breaking its $1,800 level.
The Fed’s hawkishness and traders’ expectations of higher interest rates, even though none are planned as an immediate solution to fight inflation, are keeping the level of uncertainty high, which likely means more treading water ahead.
2. ETFs in the Spotlight
In case you missed the announcement and description of this section, you can read it here again.
It features some of the 10 broadly diversified domestic and sector ETFs from my HighVolume list as posted every Saturday. Furthermore, they are screened for the lowest MaxDD% number meaning they have been showing better resistance to temporary sell offs than all others over the past year.
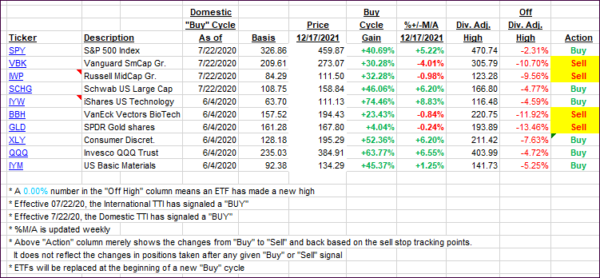
The below table simply demonstrates the magnitude with which these ETFs are fluctuating above or below their respective individual trend lines (%+/-M/A). A break below, represented by a negative number, shows weakness, while a break above, represented by a positive percentage, shows strength.
For hundreds of ETF choices, be sure to reference Thursday’s StatSheet.
For this current domestic “Buy” cycle, here’s how some our candidates have fared:

Click image to enlarge.
Again, the %+/-M/A column above shows the position of the various ETFs in relation to their respective long-term trend lines, while the trailing sell stops are being tracked in the “Off High” column. The “Action” column will signal a “Sell” once the -8% point has been taken out in the “Off High” column. For more volatile sector ETFs, the trigger point is -10%.
3. Trend Tracking Indexes (TTIs)
Our TTIs took a dive and headed toward a potential break of their respective trend lines. We are not there yet, but we need to be aware and prepared that such a break might occur, which would send the TTIs into bear market territory and subsequently generate a “Sell” signal.
This is how we closed 12/17/2021:
Domestic TTI: +3.04% above its M/A (prior close +4.74%)—Buy signal effective 07/22/2020.
International TTI: +0.36% above its M/A (prior close +1.50%)—Buy signal effective 07/22/2020.
Disclosure: I am obliged to inform you that I, as well as my advisory clients, own some of the ETFs listed in the above table. Furthermore, they do not represent a specific investment recommendation for you, they merely show which ETFs from the universe I track are falling within the specified guidelines.
All linked charts above are courtesy of Bloomberg via ZeroHedge.
———————————————————-
WOULD YOU LIKE TO HAVE YOUR INVESTMENTS PROFESSIONALLY MANAGED?
Do you have the time to follow our investment plans yourself? If you are a busy professional who would like to have his portfolio managed using our methodology, please contact me directly or get more details here.
Contact Ulli