ETF Tracker StatSheet
You can view the latest version here.
DOW CLOSES WEEK WITH NEW RECORD

- Moving the markets
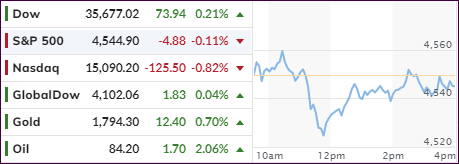
While the S&P 500 missed out on its 8th straight day of advances, the Dow powered ahead and eked out a new record high, thereby imitating yesterday’s S&P accomplishment. The latter surrendered -0.11%.
The Nasdaq was the laggard of the day, as two tech companies posted poor results. The more disappointing sales/revenue report came from powerhouse Intel, whose shares were hammered at the tune of -11% with investors not caring one bit that the miss was blamed on an industry-wide chip shortage.
Despite the S&P’s 1.7% gain this week, market jitters seem to pop up every so often, not only due to tech heavyweights like IBM and Intel disappointing, but also because of hawkish comments from Fed head Powell on inflation and policy tightening. Remember, if bond yields rise sharply, the fastest growing companies, as represented by the Nasdaq, will suffer first.
But, so far, the overall earnings season has been terrific with 84% of the 117 companies that have reported managing to beat earnings’ estimates. Consequently, the broader market has been boosted, which was reflected by this weeks’ record highs in the Dow and S&P 500.
The US Dollar limped lower today, and this week, while bond yields fell for the session, as the 10-year gave back almost 6 basis points and ended at 1.643%. This combination proved to be a boon for Gold, which at one point had gained +1.85%, while conquering the $1,800 level again, but gave back a good chunk. In the end, the precious metal still added +0.69%.
Looking at the big picture, it makes sense for equities to take a breather. After all, we just witnessed a 5% rally on seven green days for the S&P 500.
2. ETFs in the Spotlight
In case you missed the announcement and description of this section, you can read it here again.
It features some of the 10 broadly diversified domestic and sector ETFs from my HighVolume list as posted every Saturday. Furthermore, they are screened for the lowest MaxDD% number meaning they have been showing better resistance to temporary sell offs than all others over the past year.
The below table simply demonstrates the magnitude with which these ETFs are fluctuating above or below their respective individual trend lines (%+/-M/A). A break below, represented by a negative number, shows weakness, while a break above, represented by a positive percentage, shows strength.
For hundreds of ETF choices, be sure to reference Thursday’s StatSheet.
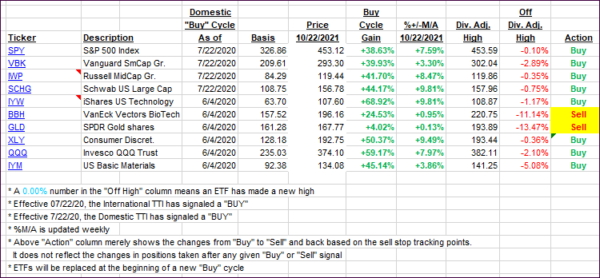
For this current domestic “Buy” cycle, here’s how some our candidates have fared:

Click image to enlarge.
Again, the %+/-M/A column above shows the position of the various ETFs in relation to their respective long-term trend lines, while the trailing sell stops are being tracked in the “Off High” column. The “Action” column will signal a “Sell” once the -8% point has been taken out in the “Off High” column. For more volatile sector ETFs, the trigger point is -10%.
3. Trend Tracking Indexes (TTIs)
Our TTIs slipped a tad as consolidation was the meme of the day.
This is how we closed 10/22/2021:
Domestic TTI: +7.62% above its M/A (prior close +7.85%)—Buy signal effective 07/22/2020.
International TTI: +4.11% above its M/A (prior close +4.30%)—Buy signal effective 07/22/2020.
Disclosure: I am obliged to inform you that I, as well as my advisory clients, own some of the ETFs listed in the above table. Furthermore, they do not represent a specific investment recommendation for you, they merely show which ETFs from the universe I track are falling within the specified guidelines.
———————————————————-
WOULD YOU LIKE TO HAVE YOUR INVESTMENTS PROFESSIONALLY MANAGED?
Do you have the time to follow our investment plans yourself? If you are a busy professional who would like to have his portfolio managed using our methodology, please contact me directly or get more details here.
Contact Ulli