ETF Tracker StatSheet
You can view the latest version here.
ENDING A POSITIVE MONTH ON A NEGATIVE NOTE

- Moving the markets
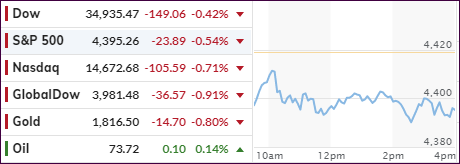
Disappointment about Amazon’s unsatisfactory earnings report, after Thursday’s close, dented any remaining optimism and the kept the major indexes in the red throughout today’s session. To no surprise, the Nasdaq suffered the most but came off its worst intra-day level, as Amazon slid over 7%.
In the end, the losses were minor but broad with equities being manhandled across the board. Other than a few sector funds, there was no place to hide as Small Caps and “value” were equally hit with “value” faring worse.
The month of July had its rollercoaster moments with the S&P 500 at one point sinking into the red. This proved to be short-lived, however, and the index managed to score its sixth positive month by adding some +2.2%.
Weaker than expected economic readings influenced market direction as well with the GDP “only” accelerating 6.5% on an annual basis vs. predictions of 8.4%. Adding insult to injury were the latest weekly jobless claims numbers, which came in higher than anticipated.
Of course, as I have pointed out many times, traders see weak econ numbers as a positive in their twisted thinking that bad news is good news, as it won’t motivate the Fed to cut down on propping up the markets via their monthly purchases of $120 billion of bonds and other QE programs.
The US Dollar index recovered from yesterday’s drubbing, while bond yields weakened with the 10-year breaking below the 1.23% level. Gold tried to maintain yesterday’s rally, but was not able to due to a stronger dollar, which caused the precious metal to give back -0.80%.
We are now entering a seasonally weak period, and it remains to be seen if the bullish trend, along with the always needed Fed assist, can prevail.
2. ETFs in the Spotlight
In case you missed the announcement and description of this section, you can read it here again.
It features some of the 10 broadly diversified domestic and sector ETFs from my HighVolume list as posted every Saturday. Furthermore, they are screened for the lowest MaxDD% number meaning they have been showing better resistance to temporary sell offs than all others over the past year.
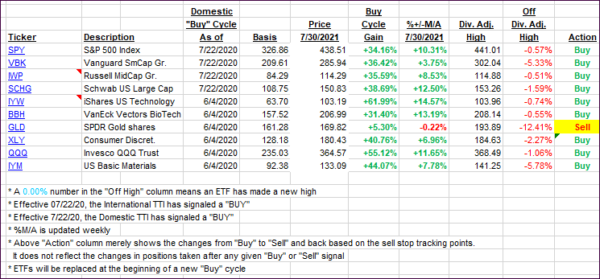
The below table simply demonstrates the magnitude with which these ETFs are fluctuating above or below their respective individual trend lines (%+/-M/A). A break below, represented by a negative number, shows weakness, while a break above, represented by a positive percentage, shows strength.
For hundreds of ETF choices, be sure to reference Thursday’s StatSheet.
For this current domestic “Buy” cycle, here’s how some our candidates have fared:

Click image to enlarge.
Again, the %+/-M/A column above shows the position of the various ETFs in relation to their respective long-term trend lines, while the trailing sell stops are being tracked in the “Off High” column. The “Action” column will signal a “Sell” once the -8% point has been taken out in the “Off High” column. For more volatile sector ETFs, the trigger point is -10%.
3. Trend Tracking Indexes (TTIs)
Our TTIs slipped with the indexes.
This is how we closed 07/30/2021:
Domestic TTI: +10.30% above its M/A (prior close +11.56%)—Buy signal effective 07/22/2020.
International TTI: +6.08% above its M/A (prior close +7.87%)—Buy signals effective 07/22/2020.
Disclosure: I am obliged to inform you that I, as well as my advisory clients, own some of the ETFs listed in the above table. Furthermore, they do not represent a specific investment
recommendation for you, they merely show which ETFs from the universe I track are falling within the specified guidelines.
All linked charts above are courtesy of Bloomberg via ZeroHedge.
———————————————————-
WOULD YOU LIKE TO HAVE YOUR INVESTMENTS PROFESSIONALLY MANAGED?
Do you have the time to follow our investment plans yourself? If you are a busy professional who would like to have his portfolio managed using our methodology, please contact me directly or get more details here.
———————————————————
Back issues of the ETF Tracker are available on the web.
Contact Ulli