ETF Tracker StatSheet
You can view the latest version here.
RISING BOND YIELDS = SLIDING TECH SECTOR

- Moving the markets
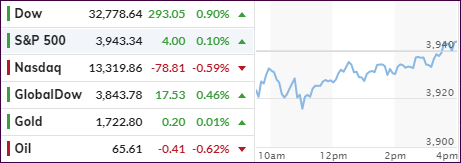
Again, it was the Nasdaq futures, falling as much as 2%, that predicted a sloppy opening of the regular session. That’s exactly what happened because bond yields spiked again, thereby taking the starch out of any investment with the word “growth” attached to it.
The 10-year bond yield dashed and topped its March 5th highs with the 30-year following suit keeping the major indexes in check. The exception was the Dow, which never dropped below its unchanged line and gained +0.90% for the day, in the process setting another record.
The S&P 500 climbed out of hole and managed to barely crawl back into the green. The Nasdaq’s attempt to do the same failed but early losses were greatly reduced.
The US Dollar inched higher by a modest amount, but today’s environment clearly belonged to the value sector with RPS and IJS, which we own, adding +1.58% and +1.46% for the session. Higher yields also benefitted the financial sector with XLF gaining +1.05%.
There is no question in my mind that higher yields, if allowed to continue to elevate, will be the biggest danger to all risk assets (equities), especially if Fed policies become less dovish at some point in the future.
Ned Davis Research seems to agree:
He estimates that the Nasdaq 100, the tech heavy index which tracks the 100 largest non-financial companies in the Nasdaq Composite, would drop another 20% if the 10-year yield hits 2%.
All bond yields have now reached pre-covid level, as Bloomberg shows in this chart. Once the inflationary forces are truly recognized, yields will continue to ramp higher.
However, keep in mind that during the initial phase of inflation, equities will rally, but once a certain, yet unknown point is breached, it will be all over for the bull market.
That’s the moment in time where the value of an exit strategy will become priceless.
2. ETFs in the Spotlight
In case you missed the announcement and description of this section, you canagain.
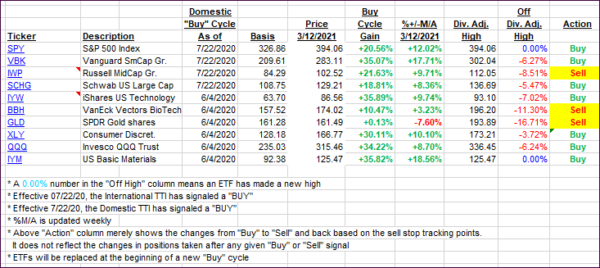
It features some of the 10 broadly diversified domestic and sector ETFs from my HighVolume list as posted every Saturday. Furthermore, they are screened for the lowest MaxDD% number meaning they have been showing better resistance to temporary sell offs than all others over the past year.
The below table simply demonstrates the magnitude with which these ETFs are fluctuating above or below their respective individual trend lines (%+/-M/A). A break below, represented by a negative number, shows weakness, while a break above, represented by a positive percentage, shows strength.
For hundreds of ETF choices, be sure to reference Thursday’s StatSheet.
For this current domestic “Buy” cycle, here’s how some our candidates have fared:

Click image to enlarge.
Again, the %+/-M/A column above shows the position of the various ETFs in relation to their respective long-term trend lines, while the trailing sell stops are being tracked in the “Off High” column. The “Action” column will signal a “Sell” once the -8% point has been taken out in the “Off High” column. For more volatile sector ETFs, the trigger point is -10%.
3. Trend Tracking Indexes (TTIs)
Our TTIs pulled back a tad, not due to market action, but the M/As were recalculated.
This is how we closed 3/12/2021:
Domestic TTI: +20.25% above its M/A (prior close +20.41%)—Buy signal effective 07/22/2020.
International TTI: +18.57% above its M/A (prior close +19.14%)—Buy signals effective 07/22/2020.
Disclosure: I am obliged to inform you that I, as well as my advisory clients, own some of the ETFs listed in the above table. Furthermore, they do not represent a specific investment recommendation for you, they merely show which ETFs from the universe I track are falling within the specified guidelines.
———————————————————-
WOULD YOU LIKE TO HAVE YOUR INVESTMENTS PROFESSIONALLY MANAGED?
Do you have the time to follow our investment plans yourself? If you are a busy professional who would like to have his portfolio managed using our methodology, please contact me directly or get more details here.
———————————————————
Back issues of the ETF Tracker are available on the web.
Contact Ulli