ETF Tracker StatSheet
You can view the latest version here.
DIVING INTO THE WEEKEND

- Moving the markets
An early rally hit the skids with the major indexes diving into the close with only the Dow showing a small gain of +0.39%. The Nasdaq fared the worst by giving back -0.36%, but for the week, equities eked out a small profit.
Helping the Dow snap a 3-day losing streak was a report showing that US Core Retail Sales surged by the most in history, according to ZH. After two straight months of disappointments, September turned out to be the shining star by showing a rise of 1.9% MoM vs. expectations of a meager 0.8%. This translates into a stunning YoY 9.1%, which was the greatest rise ever.
Of course, all that occurred with government handouts in full swing, so we need to see what happens in October, when those “assists” came to an end…
“The economy continues to show pockets of strength, but those pockets need to widen,” said Quincy Krosby, chief market strategist at Prudential Financial. “For those who still have their jobs, the economy has been healing.”
“The question is, if initial unemployment claims continue to rise, will we continue to see retail sales surprising to the upside,” Krosby added.
Regarding the stimulus saga, the signals continue to be mixed with no commitment in sight from either warring party. Although Treasury Secretary Mnuchin indicated that the White House will not derail the stimulus talks with the opposition.
While yesterday’s short squeeze continued early in the session, it lost steam late in the day thereby causing the sell-off during the last hour.
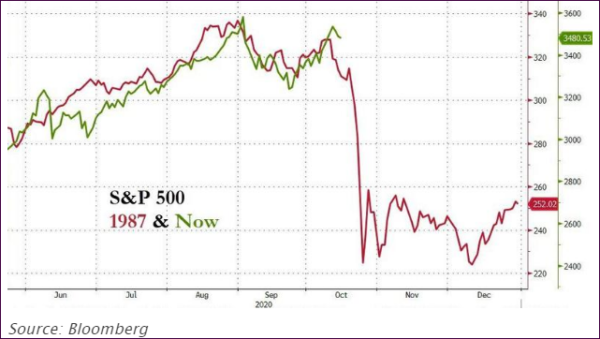
This coming Monday, October 19, marks the 33rd anniversary of the 1987 Black Monday market crash. The analog to the 1987 event is pretty much intact, as you can see in Bloomberg’s chart:

I am not forecasting that we will see a repeat, but you must admit that the similarities leading up to the “event” are striking.
2. ETFs in the Spotlight
In case you missed the announcement and description of this section, you can read it here again.
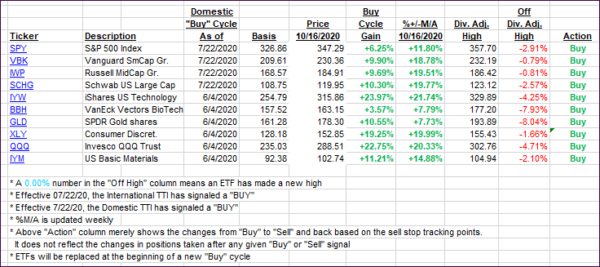
It features some of the 10 broadly diversified domestic and sector ETFs from my HighVolume list as posted every Saturday. Furthermore, they are screened for the lowest MaxDD% number meaning they have been showing better resistance to temporary sell offs than all others over the past year.
The below table simply demonstrates the magnitude with which these ETFs are fluctuating above or below their respective individual trend lines (%+/-M/A). A break below, represented by a negative number, shows weakness, while a break above, represented by a positive percentage, shows strength.
For hundreds of ETF choices, be sure to reference Thursday’s StatSheet.
For this current domestic “Buy” cycle, here’s how some our candidates have fared:

Click image to enlarge
Again, the %+/-M/A column above shows the position of the various ETFs in relation to their respective long-term trend lines, while the trailing sell stops are being tracked in the “Off High” column. The “Action” column will signal a “Sell” once the -8% point has been taken out in the “Off High” column. For more volatile sector ETFs, the trigger point is -10%.
3. Trend Tracking Indexes (TTIs)
Our TTIs changed only immaterially.
This is how we closed 10/16/2020:
Domestic TTI: +10.87% above its M/A (prior close +10.88%)—Buy signal effective 07/22/2020
International TTI: +6.34% above its M/A (prior close +5.49%)—Buy signal effective 07/22/2020
Disclosure: I am obliged to inform you that I, as well as my advisory clients, own some of the ETFs listed in the above table. Furthermore, they do not represent a specific investment recommendation for you, they merely show which ETFs from the universe I track are falling within the specified guidelines.
———————————————————-
WOULD YOU LIKE TO HAVE YOUR INVESTMENTS PROFESSIONALLY MANAGED?
Do you have the time to follow our investment plans yourself? If you are a busy professional who would like to have his portfolio managed using our methodology, please contact me directly or get more details here.
———————————————————
Back issues of the ETF Tracker are available on the web.
Contact Ulli