ETF Tracker StatSheet
You can view the latest version here.
WAVERING INTO THE WEEKEND

- Moving the markets
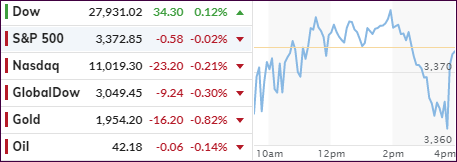
Bobbing and weaving best describes today’s market action with the major indexes clinging to their respective unchanged lines. Bulls were not in a buying mood with news about economic data lacking spunk, as did the stalled negotiations about extending the coronavirus aid.
Weaker-than-expected retail sales pulled the all-important question about the economic rebound back on the front burner, but it’s all a guessing game at this point. I believe any thoughts of a V-shape recovery is merely wishful thinking and not based on reality.
The data “underscores that wary consumers have turned more cautious amid a virus resurgence and fading stimulus support,” said Lydia Boussour, senior economist at Oxford Economics. She said the data also matches up with a stall in the firm’s own recovery tracker, confirming that “consumers are likely to keep a tight rein on their spending until a medical solution to the pandemic is found.”
(source: Marketwatch)
For the week, the S&P 500 eked out a meager +0.66%, while gold was not able to recoup all of its losses sustained early in the week. The precious metal ended down -4.5% breaking a nine-week winning streak.
The same fate happened to bonds with Treasury yields spiking 19 basis points (30-year) this week sending prices reeling. Weakness continued in the US dollar as well, which experienced its sixth drop in the last seven weeks, according to ZH.
In the end, all future equity moves higher depend predominantly on the Fed’s balance sheet continuing to expand, as Bloomberg demonstrates in this chart.
2. ETFs in the Spotlight
In case you missed the announcement and description of this section, you can read it here again.
It features some of the 10 broadly diversified domestic and sector ETFs from my HighVolume list as posted every Saturday. Furthermore, they are screened for the lowest MaxDD% number meaning they have been showing better resistance to temporary sell offs than all others over the past year.
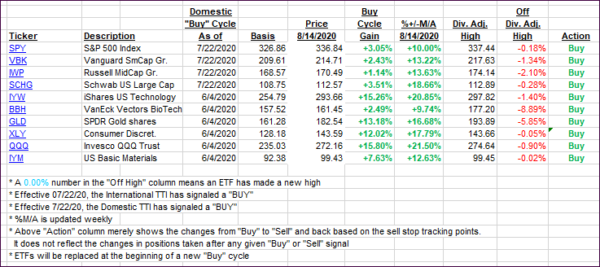
The below table simply demonstrates the magnitude with which these ETFs are fluctuating above or below their respective individual trend lines (%+/-M/A). A break below, represented by a negative number, shows weakness, while a break above, represented by a positive percentage, shows strength.
For hundreds of ETF choices, be sure to reference Thursday’s StatSheet.
For this current domestic “Buy” cycle, here’s how some our candidates have fared:

Click image to enlarge
Again, the %+/-M/A column above shows the position of the various ETFs in relation to their respective long-term trend lines, while the trailing sell stops are being tracked in the “Off High” column. The “Action” column will signal a “Sell” once the -8% point has been taken out in the “Off High” column. For more volatile sector ETFs, the trigger point is -10%.
3. Trend Tracking Indexes (TTIs)
Our TTIs changed only immaterially as the markets drifted aimlessly through this day.
This is how we closed 08/14/2020:
Domestic TTI: +7.43% above its M/A (prior close +7.14%)—Buy signal effective 07/22/2020
International TTI: +4.89% above its M/A (prior close +5.05%)—Buy signal effective 07/22/2020
Disclosure: I am obliged to inform you that I, as well as my advisory clients, own some of the ETFs listed in the above table. Furthermore, they do not represent a specific investment recommendation for you, they merely show which ETFs from the universe I track are falling within the specified guidelines.
———————————————————-
WOULD YOU LIKE TO HAVE YOUR INVESTMENTS PROFESSIONALLY MANAGED?
Do you have the time to follow our investment plans yourself? If you are a busy professional who would like to have his portfolio managed using our methodology, please contact me directly or get more details here.
———————————————————
Back issues of the ETF Tracker are available on the web.
Contact Ulli