- Moving the markets
The major indexes greeted the first full week of July with a bang after the 3-day Holiday weekend, during which we were bombarded with news of more outbreaks of the coronavirus everywhere, as well as mass shootings.
None of that mattered this morning, as the bullish theme prevailed right after the opening bell rang with the major indexes pumping higher. A late-session breather was just that and, as we’ve seen quite a bit lately, during the last 30 minutes waves of buying pulled the major indexes out of that temporary lull.
In my advisor practice, I increased our holdings in those areas that run on their own cycles and are not dependent on the TTI signals. However, intra-day, the Domestic TTI briefly broke its long-term trend line to the upside, but could not hold that advance into the close, thereby leaving that indicator still slightly negative.
The early ramp started in the Chinese markets (+7%), followed by Europe with the US also following along, despite increasing doubts about the ability to not only contain the virus outbreak but also the resulting economic fallout.
Right now, the bulls are clearly in charge, with tech remaining the front runner, and we will follow the various trends subject to our trailing sell stops.
2. ETFs in the Spotlight
In case you missed the announcement and description of this section, you can read it here again.
It features some of the 10 broadly diversified domestic and sector ETFs from my HighVolume list as posted every Saturday. Furthermore, they are screened for the lowest MaxDD% number meaning they have been showing better resistance to temporary sell offs than all others over the past year.
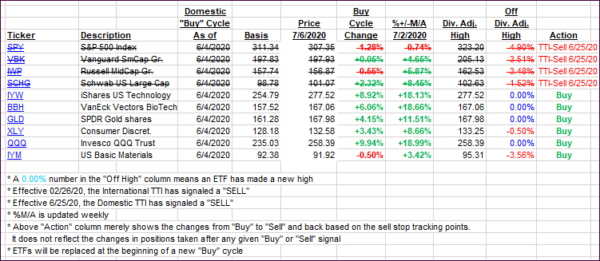
The below table simply demonstrates the magnitude with which these ETFs are fluctuating above or below their respective individual trend lines (%+/-M/A). A break below, represented by a negative number, shows weakness, while a break above, represented by a positive percentage, shows strength.
For hundreds of ETF choices, be sure to reference Thursday’s StatSheet.
For this new domestic “Buy” cycle, which ended effective 6/25/2020, here’s how some our candidates have fared:

Click image to enlarge
Again, the %+/-M/A column above shows the position of the various ETFs in relation to their respective long-term trend lines, while the trailing sell stops are being tracked in the “Off High” column. The “Action” column will signal a “Sell” once the -8% point has been taken out in the “Off High” column. For more volatile sector ETFs, the trigger point is -10%.
3. Trend Tracking Indexes (TTIs)
Our TTIs headed towards their respective trend lines but failed to close above them.
This is how we closed 07/06/2020:
Domestic TTI: -0.11% below its M/A (prior close -1.19%)—Sell signal effective 06/25/2020
International TTI: -0.51% below its M/A (prior close -2.24%)—Sell signal effective 02/26/2020
Disclosure: I am obliged to inform you that I, as well as my advisory clients, own some of the ETFs listed in the above table. Furthermore, they do not represent a specific investment recommendation for you, they merely show which ETFs from the universe I track are falling within the specified guidelines.
Contact Ulli