- Moving the markets
A lack of commitment to push the markets one way or the other was noticeably absent today, as the major indexes vacillated aimlessly around their respective unchanged lines.
Not much was gained or lost, but the Nasdaq closed in the green. Today’s report on unemployment claims showed that 1.508 million more Americans filed for first-time benefits, which was worse than the 1.29 million expected.
This brings the total number of claims, since the lockdowns began, to 46 million with no end in sight, but Bloomberg’s chart shows that downward momentum may have slowed some.
ZH noted:
What is most disturbing is that in the past 13 weeks, more than twice as many Americans have filed for unemployment than jobs gained during the last decade since the Great Recession (22.13 million gained in a decade, 45.714 million lost in 13 weeks)
Finally, it is notable, we have lost 388 jobs for every confirmed US death from COVID-19 (117,717).
This story is far from being over because what happens when the stimulus and bonus checks stop arriving after July 31st?
Noted Bloomberg:
Earnings dropped in the first quarter by 16%, the biggest decline since 2008, and are poised to fall again in the second quarter because of business disruptions tied to the coronavirus. Yet the S&P 500 has recovered most of its 34% plunge after setting a record in February.
Today’s tight trading range only had a small impact on our Trend Tracking Indexes (TTIs), which you can see in section 3. On deck is tomorrows huge option expirations’ day, the volatility of which will certainly push the indexes around more sharply compared to what we saw today.
2. ETFs in the Spotlight
In case you missed the announcement and description of this section, you can read it here again.
It features some of the 10 broadly diversified domestic and sector ETFs from my HighVolume list as posted every Saturday. Furthermore, they are screened for the lowest MaxDD% number meaning they have been showing better resistance to temporary sell offs than all others over the past year.
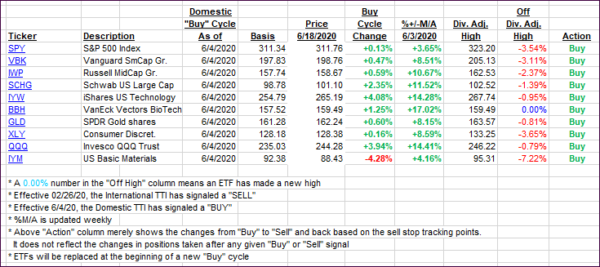
The below table simply demonstrates the magnitude with which these ETFs are fluctuating above or below their respective individual trend lines (%+/-M/A). A break below, represented by a negative number, shows weakness, while a break above, represented by a positive percentage, shows strength.
For hundreds of ETF choices, be sure to reference Thursday’s StatSheet.
For this new domestic “Buy” cycle, which was effective 6/4/2020, here’s how some our candidates have fared:

Click image to enlarge
Again, the %+/-M/A column above shows the position of the various ETFs in relation to their respective long-term trend lines, while the trailing sell stops are being tracked in the “Off High” column. The “Action” column will signal a “Sell” once the -8% point has been taken out in the “Off High” column. For more volatile sector ETFs, the trigger point is -10%.
3. Trend Tracking Indexes (TTIs)
Our TTIs barely changed keeping us stuck in the neutral zone.
This is how we closed 06/18/2020:
Domestic TTI: -0.10% below its M/A (prior close -0.03%)—Buy signal effective 06/04/2020
International TTI: -3.29% below its M/A (prior close -2.89%)—Sell signal effective 02/26/2020
Disclosure: I am obliged to inform you that I, as well as my advisory clients, own some of the ETFs listed in the above table. Furthermore, they do not represent a specific investment recommendation for you, they merely show which ETFs from the universe I track are falling within the specified guidelines.
Contact Ulli