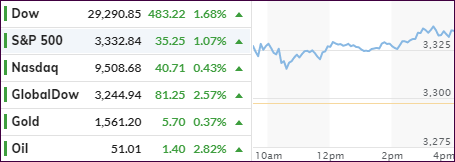
- Moving the markets
At least for the moment, it seems that nothing can disrupt this running bull market, even though, the cause of last week’s rut, namely the coronavirus, is far from being contained.
Sentiment, that stepped-up containment efforts, along with work towards new vaccines, may mitigate any negative economic impacts, was the bullish driver that sent the Dow to its second +400-point session in a row.
Hope emerged that new treatments, such as a newly developed cocktail of drugs by a Chinese university, will soon be deployed to fight the deadly virus. UK researchers also reported having made progress in lab tests towards a vaccine.
Offsetting that good news was the WHO by saying that “there are no known effective therapeutics against the coronavirus,” but that they will convene one hundred experts next week to create a plan for developing effective treatments.
Be that as it may, the markets did not care, and rumors about potential progress was all it took to keep the bullish dream alive during the entire session.
Of course, none of this could have happened without the assistance of the daily short squeeze, which again was the driver, as it has been for the past 3 trading days. ZH reported that the magnitude of this 3-day squeeze has been the biggest since the September melt-up.
I hope you are enjoying the ride.
2. ETFs in the Spotlight
In case you missed the announcement and description of this section, you can again.
It features 10 broadly diversified and sector ETFs from my HighVolume list as posted every Saturday. Furthermore, they are screened for the lowest MaxDD% number meaning they have been showing better resistance to temporary sell offs than all others over the past year.
The below table simply demonstrates the magnitude with which some of the ETFs are fluctuating regarding their positions above or below their respective individual trend lines (%+/-M/A). A break below, represented by a negative number, shows weakness, while a break above, represented by a positive percentage, shows strength.
For hundreds of ETF choices, be sure to reference Thursday’s StatSheet.
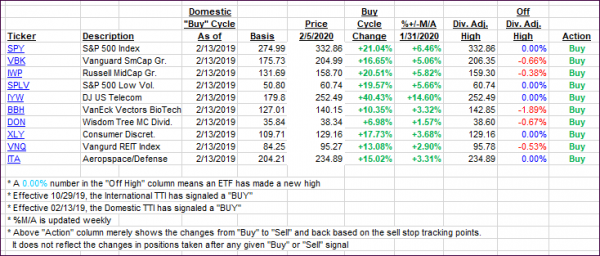
For this current domestic “Buy” cycle, here’s how some our candidates have fared:

Click image to enlarge
Again, the %+/-M/A column above shows the position of the various ETFs in relation to their respective long-term trend lines, while the trailing sell stops are being tracked in the “Off High” column. The “Action” column will signal a “Sell” once the -8% point has been taken out in the “Off High” column. For more volatile sector ETFs, the trigger point is -10%.
3. Trend Tracking Indexes (TTIs)
Our Trend Tracking Indexes (TTIs) again jumped with the Dow scoring its second +400-point day in a row.
Here’s how we closed 02/05/2020:
Domestic TTI: +8.25% above its M/A (prior close +6.70%)—Buy signal effective 02/13/2019
International TTI: +5.25% above its M/A (prior close +4.11%)—Buy signal effective 10/29/2019
Disclosure: I am obliged to inform you that I, as well as my advisory clients, own some of the ETFs listed in the above table. Furthermore, they do not represent a specific investment recommendation for you, they merely show which ETFs from the universe I track are falling within the specified guidelines.
Contact Ulli