- Moving the markets
As expected, the Fed left interest rates on hold but indicated that they have no plans for any changes through the end of 2020. In fact, the assessment of the economy was more upbeat, which caused market sentiment to remain cautious.
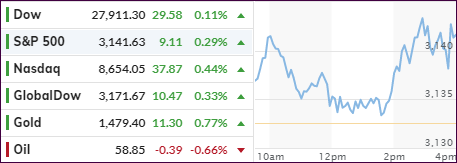
Powell reiterated that the “current stance of monetary policy is appropriate” to sustain an economic expansion, strong labor markets and inflation near its 2% target. In other words, he considers the “policy somewhat accommodative,” which gave markets a boost that assured a green close.
During his speech, Powell was pressed on the issues in the overnight funding markets, to which he admitted that “if its does become appropriate to buy something other than T-Bills, the Fed will do so.”
The reference was to the Fed’s current monthly $60 billion in purchase of T-Bills, which had been called “non-QE.” He has now opened the spigot to purchase other assets as well, such as longer-term bonds. At that point the objective is clear in that this will be for sure QE4, or an outright monetization of debt.
The US dollar sold off sharply and slumped to 5-month lows, while the 10-year bond yield dropped to close a tad below the 1.80% level.
All eyes are now on the Fed and when it will enact the new QE4, which can easily be caused by accelerating year-end problems in the overnight lending markets, where the underlying financial plumbing issues continue to deteriorate. From my understanding, some of these must be addressed and fixed prior to year-end.
I will be watching closely for any fallout that might occur.
2. ETFs in the Spotlight
In case you missed the announcement and description of this section, you can read it here again.
It features 10 broadly diversified and sector ETFs from my HighVolume list as posted every Saturday. Furthermore, they are screened for the lowest MaxDD% number meaning they have been showing better resistance to temporary sell offs than all others over the past year.
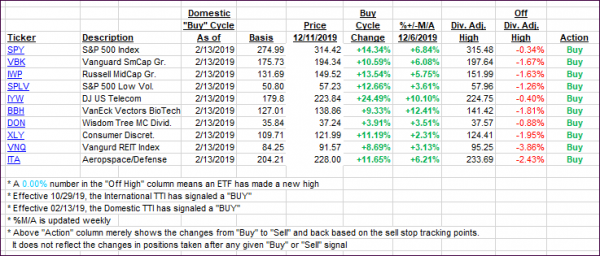
The below table simply demonstrates the magnitude with which some of the ETFs are fluctuating regarding their positions above or below their respective individual trend lines (%+/-M/A). A break below, represented by a negative number, shows weakness, while a break above, represented by a positive percentage, shows strength.
For hundreds of ETF choices, be sure to reference Thursday’s StatSheet.
For this current domestic “Buy” cycle, here’s how some our candidates have fared:

Click image to enlarge
Again, the %+/-M/A column above shows the position of the various ETFs in relation to their respective long-term trend lines, while the trailing sell stops are being tracked in the “Off High” column. The “Action” column will signal a “Sell” once the -8% point has been taken out in the “Off High” column. For more volatile sector ETFs, the trigger point is -10%.
3. Trend Tracking Indexes (TTIs)
Our Trend Tracking Indexes (TTIs) bounced higher, as the Fed announcement was overall positive for the markets.
Here’s how we closed 12/11/2019:
Domestic TTI: +5.87% above its M/A (prior close +5.56%)—Buy signal effective 02/13/2019
International TTI: +4.18% above its M/A (prior close +3.72%)—Buy signal effective 10/29/2019
Disclosure: I am obliged to inform you that I, as well as my advisory clients, own some of the ETFs listed in the above table. Furthermore, they do not represent a specific investment recommendation for you, they merely show which ETFs from the universe I track are falling within the specified guidelines.
Contact Ulli