- Moving the markets
An early rally petered out, as the S&P 500 briefly surpassed another milestone, namely the 3,100 level, and then faded towards its unchanged line. The move was based on nothing but hope that Trump would later, during a scheduled speech, elaborate about the China trade deal.
Focused on that target, and that good news might be on the horizon, the army of computer algos combined forces and gave an assist via a short squeeze, which later puked, just as happened yesterday.
Trump’s comments disappointed somewhat, although he said “a significant phase one” trade deal could happen soon, but that he would accept it only if the agreement worked out to the advantage of U.S. workers and businesses. While that is a noble idea, it’s not one the headline scanning algos took as a positive, so down we went with most the early gains evaporating and the Dow turning negative.
The fly in ointment, contributing to the pullback, was a rebuttal by the unofficial Chinese mouthpiece Global Times, which tweeted:
Quite a lot of criticisms and complaints about China from President Trump in his latest speech, but hardly anything new. Similar statements of senior US officials have bored people. It seems this US administration really believes a lie repeated a thousand times becomes truth.
Cautious optimism also went out the window due to a Wednesday deadline looming as to whether Trump will put off the intended 25% tariffs on European auto imports. If he doesn’t, that could be a drag on the markets, which makes me believe that this decision will be pushed back.
More uncertainty is on the way with Fed head Powell to be scheduled to give a congressional testimony on the state of the economy, which is due tomorrow at noon. We may very well see much treading of water in the indexes until Powell’s speech is dissected down to his every word.
2. ETFs in the Spotlight
In case you missed the announcement and description of this section, you can read it here again.
It features 10 broadly diversified and sector ETFs from my HighVolume list as posted every Saturday. Furthermore, they are screened for the lowest MaxDD% number meaning they have been showing better resistance to temporary sell offs than all others over the past year.
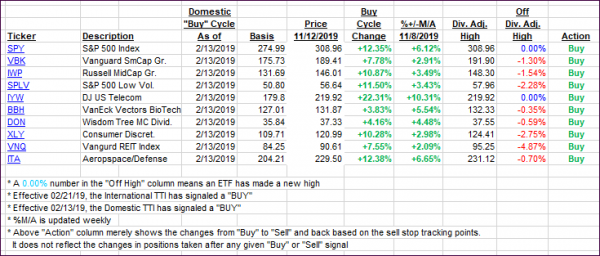
The below table simply demonstrates the magnitude with which some of the ETFs are fluctuating regarding their positions above or below their respective individual trend lines (%+/-M/A). A break below, represented by a negative number, shows weakness, while a break above, represented by a positive percentage, shows strength.
For hundreds of ETF choices, be sure to reference Thursday’s StatSheet.
For this current domestic “Buy” cycle, here’s how some our candidates have fared:

Again, the %+/-M/A column above shows the position of the various ETFs in relation to their respective long-term trend lines, while the trailing sell stops are being tracked in the “Off High” column. The “Action” column will signal a “Sell” once the -8% point has been taken out in the “Off High” column. For more volatile sector ETFs, the trigger point is -10%.
3. Trend Tracking Indexes (TTIs)
Our Trend Tracking Indexes (TTIs) inched up a tad, with a sideways pattern being the dominant force today.
Here’s how we closed 11/12/2019:
Domestic TTI: +5.43% above its M/A (prior close +5.37%)—Buy signal effective 02/13/2019
International TTI: +4.24% above its M/A (prior close +4.10%)—Buy signal effective 10/29/2019
Disclosure: I am obliged to inform you that I, as well as my advisory clients, own some of the ETFs listed in the above table. Furthermore, they do not represent a specific investment recommendation for you, they merely show which ETFs from the universe I track are falling within the specified guidelines.
Contact Ulli