- Moving the markets
President Trump set the tone early on for today’s rally by suggesting that “today will be a good day in the stock market,” and just in case the computer algos missed his prediction, he created more excitement via his remark that “the China deal is moving forward ahead of schedule.”
Of course, we know by now that things like global liquidity and short squeezes rule supreme when it comes to pushing markets higher, as this chart shows.
All the above turned out to be enough to extend the S&P’s move into record territory, while the Dow and Nasdaq were just hovering below their respective record closes set in late July. Of course, traders’ focus remained on the still outstanding earnings reports, of which 162 S&P 500 companies will release their report cards this week.
Earnings from one of the bigger names, like AT&T, were market pleasing with the media giant topping third quarter expectations, while announcing a plan to grow earnings per share by at least 33% by 2020.
Other news, which did not affect markets were the Fed’s meeting on interest rates with the verdict due out Wednesday. A quarter point reduction is expected, and the Fed will have to deliver or the markets sure will have a tizzy fit.
It’s noteworthy, that today was the third day in a row during which bond yields jumped (today by about 5 basis points), and the markets rallied anyway. Usually, rising bond yields tend to pull down equities, but we appear to be stuck in a moment in time, where the opposite is occurring.
That has been a negative, as I posted on Friday, for the low volatility ETF (SPLV), which gave back -0.49% for the day, while the S&P 500 (SPY) managed to score a gain of +0.58%.
Yet, YTD for our current ‘Buy’ signal, the SPLV still has notched superior gains (+12.20%) and remains ahead of SPY (+10.31%), but the victory margin has narrowed. When rates head back south again, however, we will see the pendulum swing back the other way.
2. ETFs in the Spotlight
In case you missed the announcement and description of this section, you can read it here again.
It features 10 broadly diversified and sector ETFs from my HighVolume list as posted every Saturday. Furthermore, they are screened for the lowest MaxDD% number meaning they have been showing better resistance to temporary sell offs than all others over the past year.
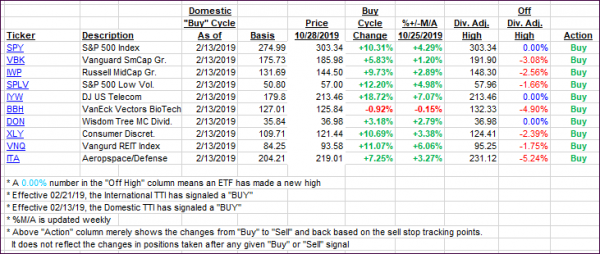
The below table simply demonstrates the magnitude with which some of the ETFs are fluctuating regarding their positions above or below their respective individual trend lines (%+/-M/A). A break below, represented by a negative number, shows weakness, while a break above, represented by a positive percentage, shows strength.
For hundreds of ETF choices, be sure to reference Thursday’s StatSheet.
For this current domestic “Buy” cycle, here’s how some our candidates have fared:

Again, the %+/-M/A column above shows the position of the various ETFs in relation to their respective long-term trend lines, while the trailing sell stops are being tracked in the “Off High” column. The “Action” column will signal a “Sell” once the -8% point has been taken out in the “Off High” column. For more volatile sector ETFs, the trigger point is -10%.
3. Trend Tracking Indexes (TTIs)
Our Trend Tracking Indexes (TTIs) both gained. With today’s move, the International TTI has now shown enough staying power to justify a new ‘Buy” signal, effective tomorrow. This signal applies only to “broadly diversified international equity ETFs/Mutual Funds.”
Here’s how we closed 10/28/2019:
Domestic TTI: +4.32% above its M/A (prior close +3.99%)—Buy signal effective 02/13/2019
International TTI: +2.35% above its M/A (prior close +2.07%)—Sell signal effective 10/03/2019
Disclosure: I am obliged to inform you that I, as well as my advisory clients, own some of the ETFs listed in the above table. Furthermore, they do not represent a specific investment recommendation for you, they merely show which ETFs from the universe I track are falling within the specified guidelines.
Contact Ulli