- Moving the markets
The markets edged higher to start the week with Boeing being a drag on the Dow capping the gains by some 100 points. The S&P 500 managed to finally hold above its 3,000 level but is now homing in on overhead resistance lurking at around 3,020. Then index also has failed to close the breakaway gap (blue circle), which means a retracement will be in order at some time.
However, for right now, the computer algos are chasing headline news and front running any suggestions that Beijing and China have successfully laid the groundwork to solidify a solution to the long-running trade disagreement.
Assisting the bullish theme was another short-squeeze, which helped the indexes to stay in the green and kept the mood upbeat.
In the meantime, the Brexit saga continues full force with UK’s PM Johnson experiencing a setback, which traders liked, since some are of the opinion that a Brexit without a trade agreement could disrupt global markets even further.
On the earnings front, we learned that 75 of the S&P 500 companies have reported with 82.7% showing better-than-expected results. Of course, the bar has been lowered considerably, but when it comes to headlines, a “beat is a beat.” This weak, we have 130 more candidates presenting their report cards, and we will have to see if the above numbers hold up.
On a personal note, I’d like to thank all of you who have emailed and wished me a speedy recovery from my eye surgery last Friday night. It was successful, and I thank you for your kind words.
2. ETFs in the Spotlight
In case you missed the announcement and description of this section, you can read it here again.
It features 10 broadly diversified and sector ETFs from my HighVolume list as posted every Saturday. Furthermore, they are screened for the lowest MaxDD% number meaning they have been showing better resistance to temporary sell offs than all others over the past year.
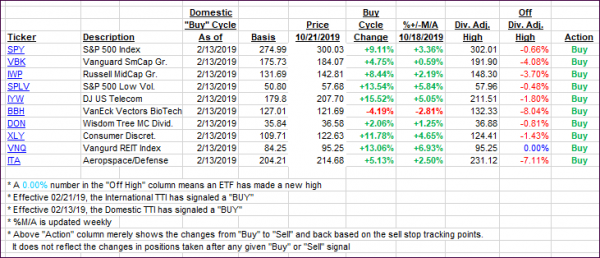
The below table simply demonstrates the magnitude with which some of the ETFs are fluctuating regarding their positions above or below their respective individual trend lines (%+/-M/A). A break below, represented by a negative number, shows weakness, while a break above, represented by a positive percentage, shows strength.
For hundreds of ETF choices, be sure to reference Thursday’s StatSheet.
For this current domestic “Buy” cycle, here’s how some our candidates have fared:

Again, the %+/-M/A column above shows the position of the various ETFs in relation to their respective long-term trend lines, while the trailing sell stops are being tracked in the “Off High” column. The “Action” column will signal a “Sell” once the -8% point has been taken out in the “Off High” column. For more volatile sector ETFs, the trigger point is -10%.
3. Trend Tracking Indexes (TTIs)
Our Trend Tracking Indexes (TTIs) advanced as the week started out on a positive note.
Here’s how we closed 10/21/2019:
Domestic TTI: +3.57% above its M/A (prior close +2.89%)—Buy signal effective 02/13/2019
International TTI: +1.80% above its M/A (prior close +1.15%)—Sell signal effective 10/03/2019
Disclosure: I am obliged to inform you that I, as well as my advisory clients, own some of the ETFs listed in the above table. Furthermore, they do not represent a specific investment recommendation for you, they merely show which ETFs from the universe I track are falling within the specified guidelines.
Contact Ulli