- Moving the markets
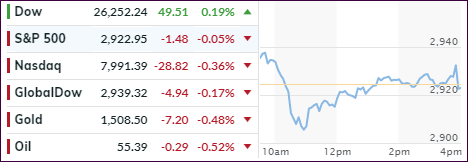
An early rally fizzled, as uncertainty over the outlook of interest rates kept traders on edge, especially due to the upcoming Fed statement regarding the Jackson Hole meetings. I think Fed head Powell’s position on rates is well known, and his upcoming speech on Friday is likely to disappoint those hoping for more dovishness.
Not helping the markets was an announcement by the German Bundesbank proclaiming that “they don’t see a need right now for fiscal stimulus at this time, even though they expect the economy to shrink again this quarter.”
That was totally opposite of what was expected, and markets started to sag. Then another hawkish nightmare appeared out of nowhere when the Fed’s Patrick Harker opined in an interview that “he doesn’t see any need for further stimulus at the moment.”
Some of his soundbites included:
- “Yield curve is only one of many signals.”
- “Trade issue makes business decisions difficult.”
- “Growth now is exactly what we had anticipated last year.”
- “No need for another rate cut, central bank should stay here for a while.”
- “Trade resolution would boost growth.”
Ouch. That was not exactly what traders had hoped for, so the markets continued riding the range but managed to eradicate some of the early session losses.
Nevertheless, Fed chair Powell is set to deliver a speech tomorrow, during which investors will be eagerly looking for clues as to whether another rate cut will be on deck for September.
2. ETFs in the Spotlight
In case you missed the announcement and description of this section, you can read it here again.
It features 10 broadly diversified and sector ETFs from my HighVolume list as posted every Saturday. Furthermore, they are screened for the lowest MaxDD% number meaning they have been showing better resistance to temporary sell offs than all others over the past year.
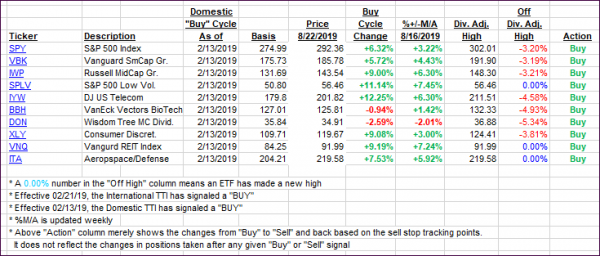
The below table simply demonstrates the magnitude with which some of the ETFs are fluctuating regarding their positions above or below their respective individual trend lines (%+/-M/A). A break below, represented by a negative number, shows weakness, while a break above, represented by a positive percentage, shows strength.
For hundreds of ETF choices, be sure to reference Thursday’s StatSheet.
For this current domestic “Buy” cycle, here’s how some our candidates have fared:

Again, the %+/-M/A column above shows the position of the various ETFs in relation to their respective long-term trend lines, while the trailing sell stops are being tracked in the “Off High” column. The “Action” column will signal a “Sell” once the -8% point has been taken out in the “Off High” column. For more volatile sector ETFs, the trigger point is -10%.
3. Trend Tracking Indexes (TTIs)
Our Trend Tracking Indexes (TTIs) barely changed, as the markets were stuck in a sideways pattern.
Here’s how we closed 08/22/2019:
Domestic TTI: +2.83% above its M/A (prior close +2.76%)—Buy signal effective 02/13/2019
International TTI: -1.00% below its M/A (prior close -0.83%)—Sell signal effective 08/15/2019
Disclosure: I am obliged to inform you that I, as well as my advisory clients, own some of the ETFs listed in the above table. Furthermore, they do not represent a specific investment recommendation for you, they merely show which ETFs from the universe I track are falling within the specified guidelines.
Contact Ulli