- Moving the markets
The fallout from the Fed’s soft outlook on interest rates was, so far, overwhelmingly positive with the bulls grabbing the baton and storming deeper into bullish territory. While the idea that no rate hikes on the horizon for 2019 stoked equity investors, worries kept creeping up that this was just a function of a slowing economy that could eventually result in the much-dreaded recession.
Be that as it may, right now the trend is bullish, and the major indexes, led by the Nasdaq, closed solidly higher. The gains were broad with our sector holdings making nice advances. Powerhouse Apple dominated the indexes by adding +3.68% and reclaiming its 200-day M/A, while buy-backs and short-squeezes combined their efforts to make this a miserable day for the bears.
The U.S. Dollar did a complete U-turn and retraced all of yesterday’s losses in one session, while Financials, which are negatively affected by lower rates, kept slipping and sliding.
It was a good day for the bulls, but we need continued steady upward momentum, which possibly could get a boost from the upcoming earnings season.
- ETFs in the Spotlight
In case you missed the announcement and description of this section, you can read it here again.
It features 10 broadly diversified and sector ETFs from my HighVolume list as posted every Saturday. Furthermore, they are screened for the lowest MaxDD% number meaning they have been showing better resistance to temporary sell offs than all others over the past year.
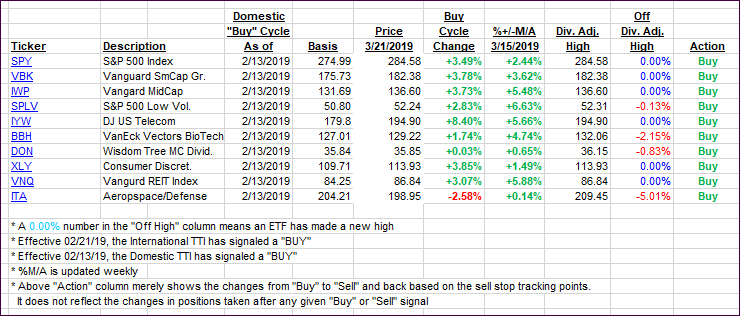
The below table simply demonstrates the magnitude with which some of the ETFs are fluctuating regarding their positions above or below their respective individual trend lines (%+/-M/A). A break below, represented by a negative number, shows weakness, while a break above, represented by a positive percentage, shows strength.
For hundreds of ETF choices, be sure to reference Thursday’s StatSheet.
For this current domestic “Buy” cycle, here’s how some our candidates have fared:
Again, the %+/-M/A column above shows the position of the various ETFs in relation to their respective long-term trend lines, while the trailing sell stops are being tracked in the “Off High” column. The “Action” column will signal a “Sell” once the -8% point has been taken out in the “Off High” column. For more volatile sector ETFs, the trigger point is -10%.
- Trend Tracking Indexes (TTIs)
Our Trend Tracking Indexes (TTIs) ended up higher with especially the Domestic one taking a giant jump deeper into bullish territory.
Here’s how we closed 03/21/2019:
Domestic TTI: +3.65% above its M/A (last close +2.33%)—Buy signal effective 02/13/2019
International TTI: +2.77% above its M/A (last close +2.57%)—Buy signal effective 02/21/2019
Disclosure: I am obliged to inform you that I, as well as my advisory clients, own some of the ETFs listed in the above table. Furthermore, they do not represent a specific investment recommendation for you, they merely show which ETFs from the universe I track are falling within the specified guidelines.
Contact Ulli

