ETF Tracker StatSheet
ABYSMAL JOBS REPORT SENDS EQUITIES LOWER
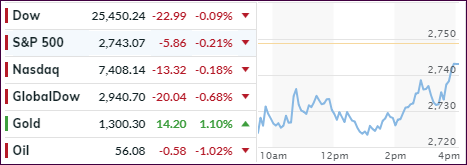
[Chart courtesy of MarketWatch.com]- Moving the markets
Today, it was a dismal jobs number that put equity markets on the defensive, as an ‘ugly’ payroll report showed that only 20k jobs were generated during February. It was filed in the “just bad enough” category that even computer algos did not register it as good news for stocks, which otherwise would have sent markets surging.
Why?
Because this was for sure another nail in the coffin of any future rate hikes. And not just that, it may very well be pointing in the direction of potential rate decreases and possibly the implementation of more QE (Quantitative Easing). In other words, it confirms what I have been posting about, namely that a continued global slowdown is a real possibility, and the U.S. will not be isolated from it.
Even President Trump’s attempt to ‘juice’ the markets by declaring that, as soon as the China deal is done, “we will see a very big spike” fell on deaf ears and had no effect. Wiping out the mid-day rebound were news that China’s Xi had cancelled his future meeting with Trump at the Mar-A-Lago estate, where allegedly the trade deal was supposed to be signed.
The major indexes bobbed and weaved below their respective unchanged lines, until a late rally wiped out most of the earlier losses and pushed the Dow almost into positive territory. However, we fell short of that goal but recovered nicely.
The exception was the Transportation Index (IYT), which has been down for 11 straight days, it’s worst losing streak since Nixon reigned in 1972. This is significant only in the sense that this gauge is closely watched due to it representing the health of the overall economy.
The gap between reality and stock prices is far too wide, as this chart shows, leaving me pondering: Will earnings move up to justify current prices or will the S&P move down to meet earnings levels?
- ETFs in the Spotlight
In case you missed the announcement and description of this section, you can read it here again.
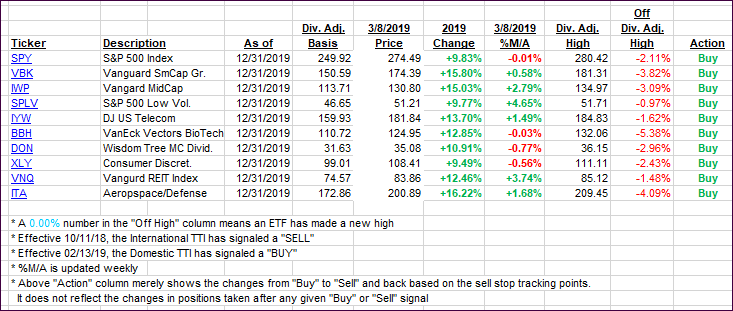
It features 10 broadly diversified and sector ETFs from my HighVolume list as posted every Saturday. Furthermore, they are screened for the lowest MaxDD% number meaning they have been showing better resistance to temporary sell offs than all others over the past year.
The below table simply demonstrates the magnitude with which some of the ETFs are fluctuating regarding their positions above or below their respective individual trend lines (%M/A). A break below, represented by a negative number, shows weakness, while a break above, represented by a positive percentage, shows strength.
For hundreds of ETF choices, be sure to reference Thursday’s StatSheet.
Year to date, here’s how some our current candidates for this current ‘Buy’ cycle have fared:
Again, the %M/A column above shows the position of the various ETFs in relation to their respective long-term trend lines, while the trailing sell stops are being tracked in the “Off High” column. The “Action” column will signal a “Sell” once the -8% point has been taken out in the “Off High” column. For more volatile sector ETFs, the trigger point is -10%.
- Trend Tracking Indexes (TTIs)
Our Trend Tracking Indexes (TTIs) headed south again with the Domestic one remaining on the bullish side of its trend line, while the International one has slipped below its line for the second day in a row. Again, I need to see more slippage and staying power before declaring an International ‘Sell’ signal. Otherwise, the chance of a whip-saw signal is simply too great.
Here’s how we closed 03/08/2019:
Domestic TTI: +0.80% above its M/A (last close +1.09%)—Buy signal effective 02/13/2019
International TTI: -0.81% below its M/A (last close -0.37%)—Buy signal effective 02/21/2019
Disclosure: I am obliged to inform you that I, as well as my advisory clients, own some of the ETFs listed in the above table. Furthermore, they do not represent a specific investment recommendation for you, they merely show which ETFs from the universe I track are falling within the specified guidelines.
———————————————————-
WOULD YOU LIKE TO HAVE YOUR INVESTMENTS PROFESSIONALLY MANAGED?
Do you have the time to follow our investment plans yourself? If you are a busy professional who would like to have his portfolio managed using our methodology, please contact me directly or get more details at:
https://theetfbully.com/personal-investment-management/
———————————————————
Back issues of the ETF/No Load Fund Tracker are available on the web at:
https://theetfbully.com/newsletter-archives/
Contact Ulli

